Fig. 2
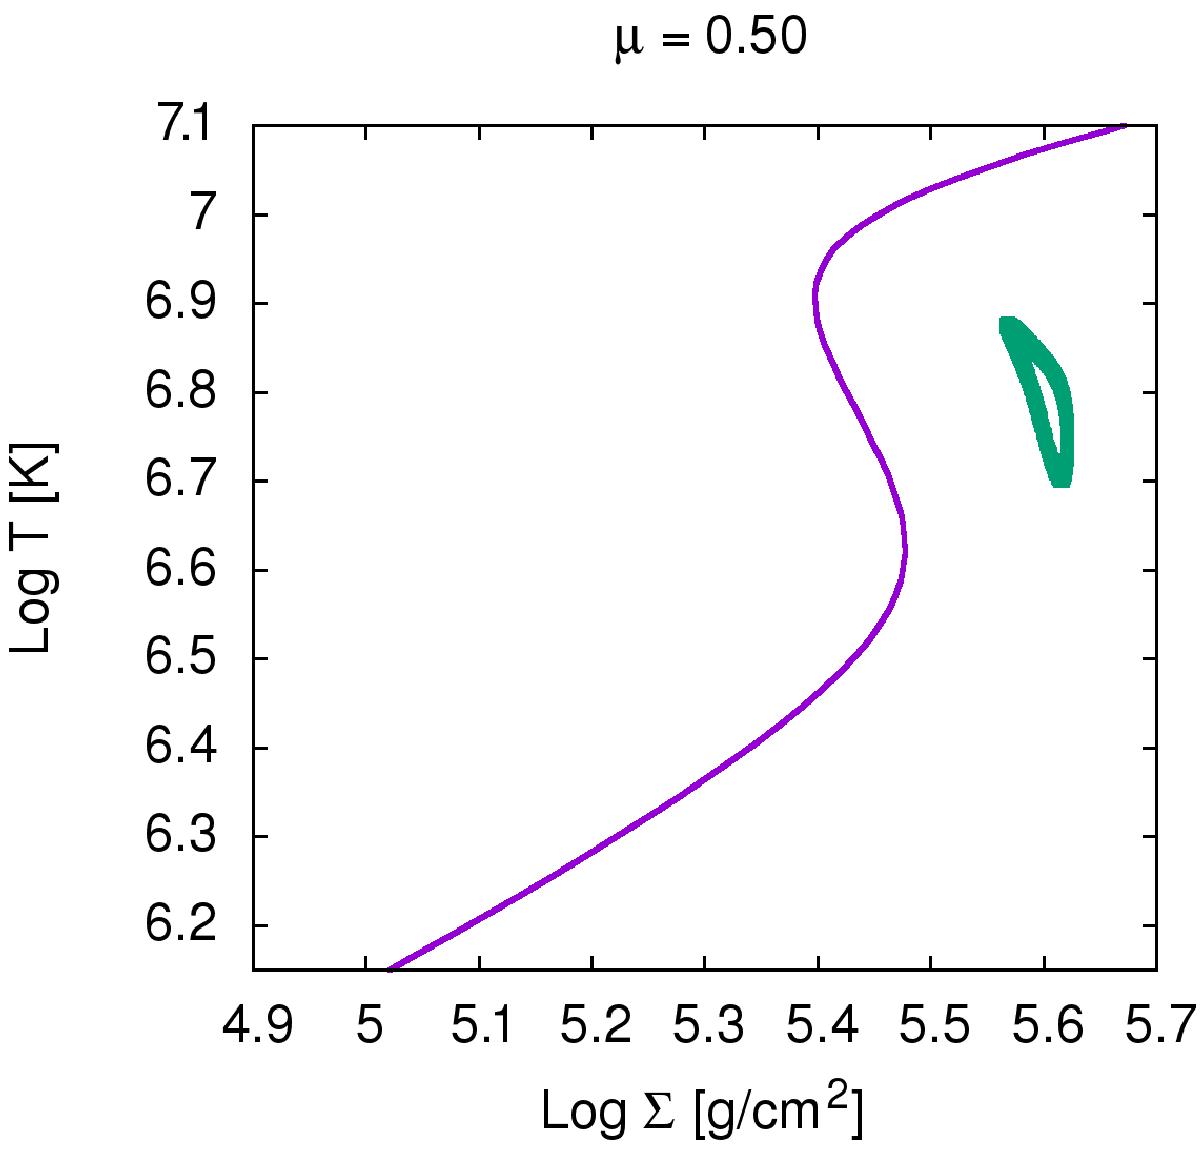
T and Σ variability for the model with μ = 0.5 for a typical IMBH accretion disk. The computation shows a weakly developed instability. Parameters: M = 3 × 10⁴M⊙, α = 0.02, and ṁ = 0.25. The plot is made for the radius ![]() cm. The red curve represents the stationary model and the green dots show local values of the temperature for the time-dependent computation.
cm. The red curve represents the stationary model and the green dots show local values of the temperature for the time-dependent computation.
Current usage metrics show cumulative count of Article Views (full-text article views including HTML views, PDF and ePub downloads, according to the available data) and Abstracts Views on Vision4Press platform.
Data correspond to usage on the plateform after 2015. The current usage metrics is available 48-96 hours after online publication and is updated daily on week days.
Initial download of the metrics may take a while.