Free Access
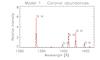
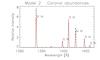
Fig. 9

Calculated synthetic spectrum observable in IRIS with the coronal abundances (full red lines) for Model 1 (top) and Model 2 (bottom) in a comparison with the Maxwellian spectrum for the same temperature and density structure of the loop (dashed black lines).
This figure is made of several images, please see below:
Current usage metrics show cumulative count of Article Views (full-text article views including HTML views, PDF and ePub downloads, according to the available data) and Abstracts Views on Vision4Press platform.
Data correspond to usage on the plateform after 2015. The current usage metrics is available 48-96 hours after online publication and is updated daily on week days.
Initial download of the metrics may take a while.