Fig. 2
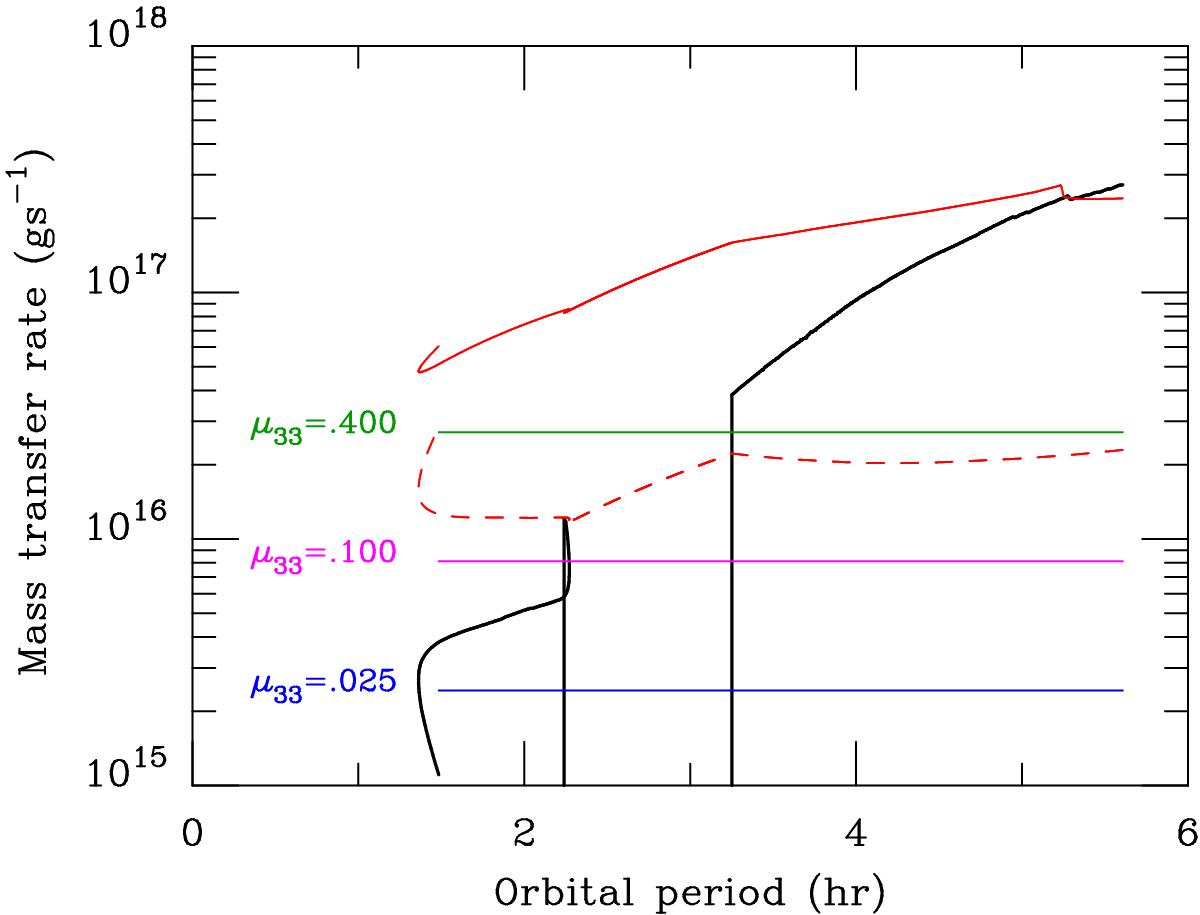
Critical mass transfer for stability. The upper red curve represents the critical mass transfer rate above which discs are hot and stable. The expected secular mean of the mass transfer is given by the black curve (details can be found in the main text). The green, magenta and blue curves represent the critical mass transfer below which discs are cold and stable (Eq. (4)), for magnetic moments of 4 × 1032, × 1032 and 2.5 × 1031 G cm3 respectively. The disc exists only if its inner radius is smaller than the circularisation radius; the dashed red curve shows the maximum possible mass transfer allowing the disc to be stable and cold at 1.5rcirc.
Current usage metrics show cumulative count of Article Views (full-text article views including HTML views, PDF and ePub downloads, according to the available data) and Abstracts Views on Vision4Press platform.
Data correspond to usage on the plateform after 2015. The current usage metrics is available 48-96 hours after online publication and is updated daily on week days.
Initial download of the metrics may take a while.