Fig. 5
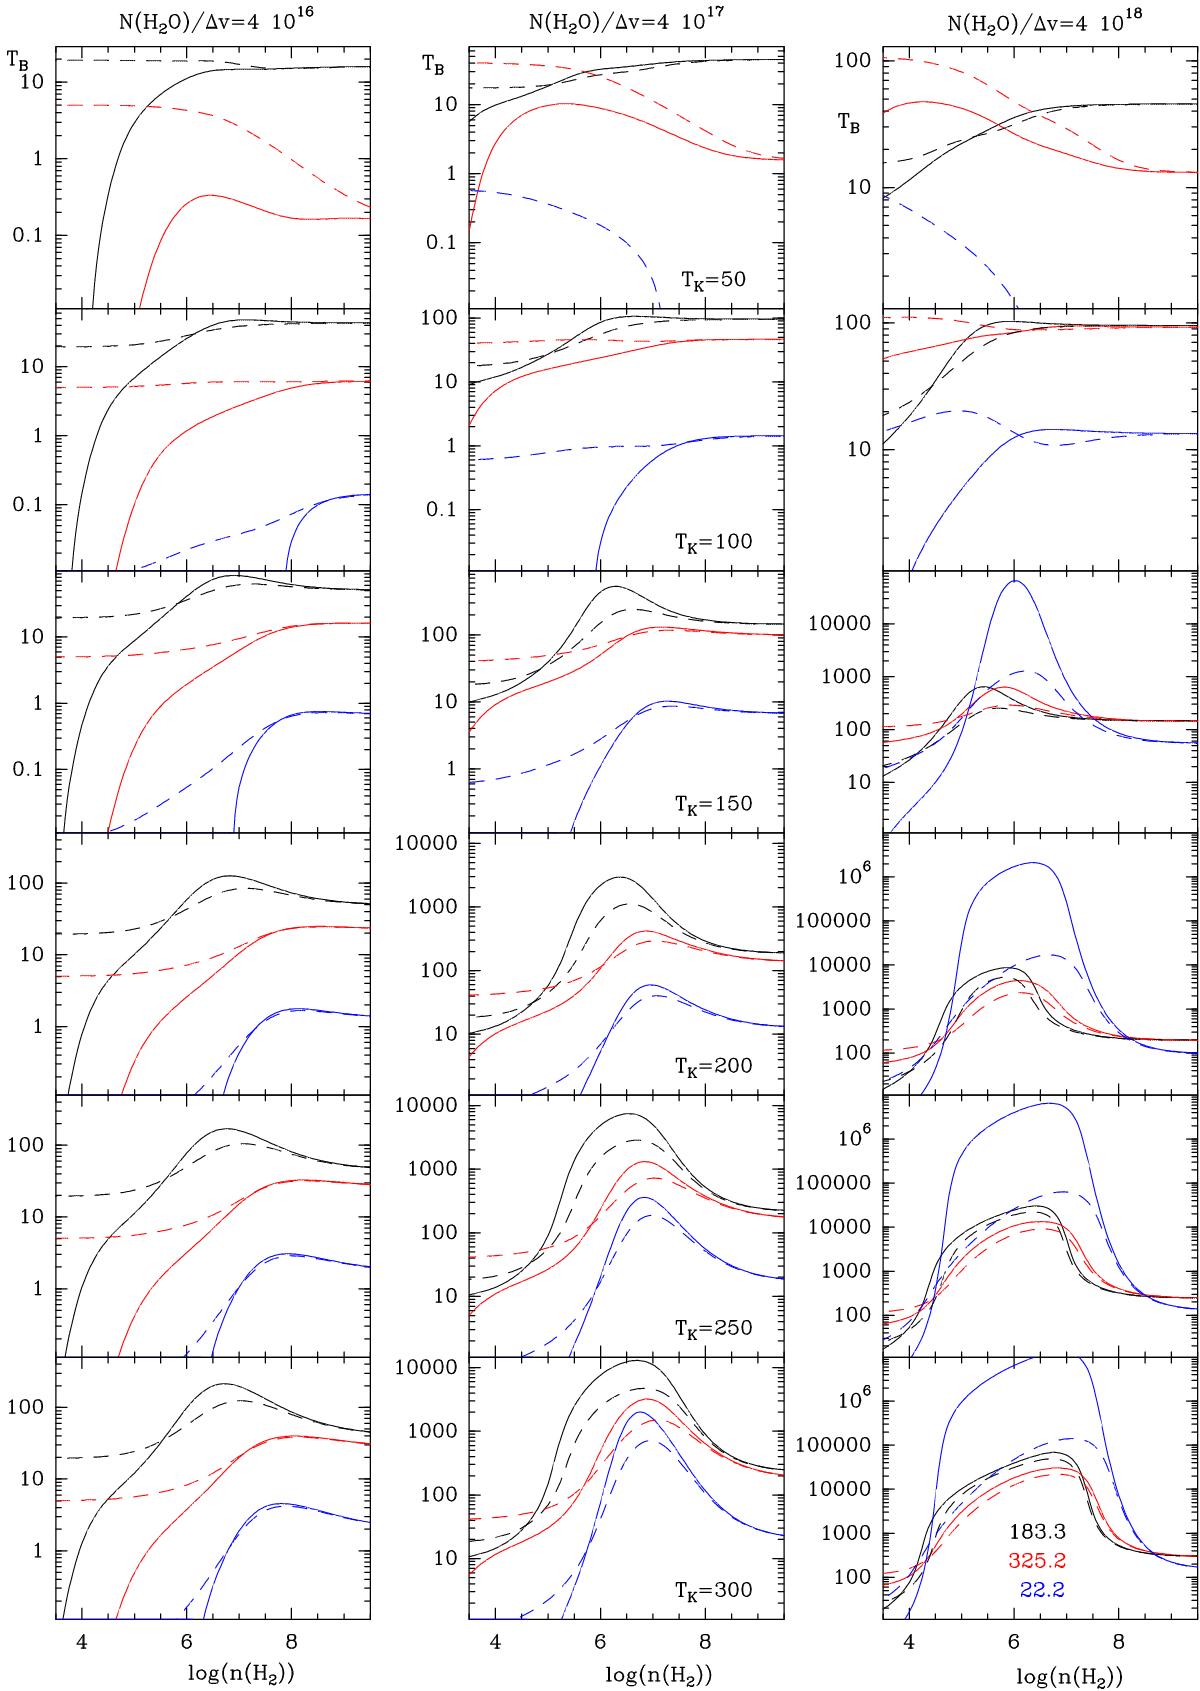
LVG models covering a wide range of physical conditions for three different column densities. For six different kinetic temperatures (TK), the gas temperature variation over a range of H2 densities is shown. The blue, black, and red colors represent the results for the 22, 183, and 325 GHz lines, respectively. Solid lines represent the expected intensities without continuum emission while dashed lines show the results when infrared pumping from dust is taken into account.
Current usage metrics show cumulative count of Article Views (full-text article views including HTML views, PDF and ePub downloads, according to the available data) and Abstracts Views on Vision4Press platform.
Data correspond to usage on the plateform after 2015. The current usage metrics is available 48-96 hours after online publication and is updated daily on week days.
Initial download of the metrics may take a while.