Free Access
Fig. 3
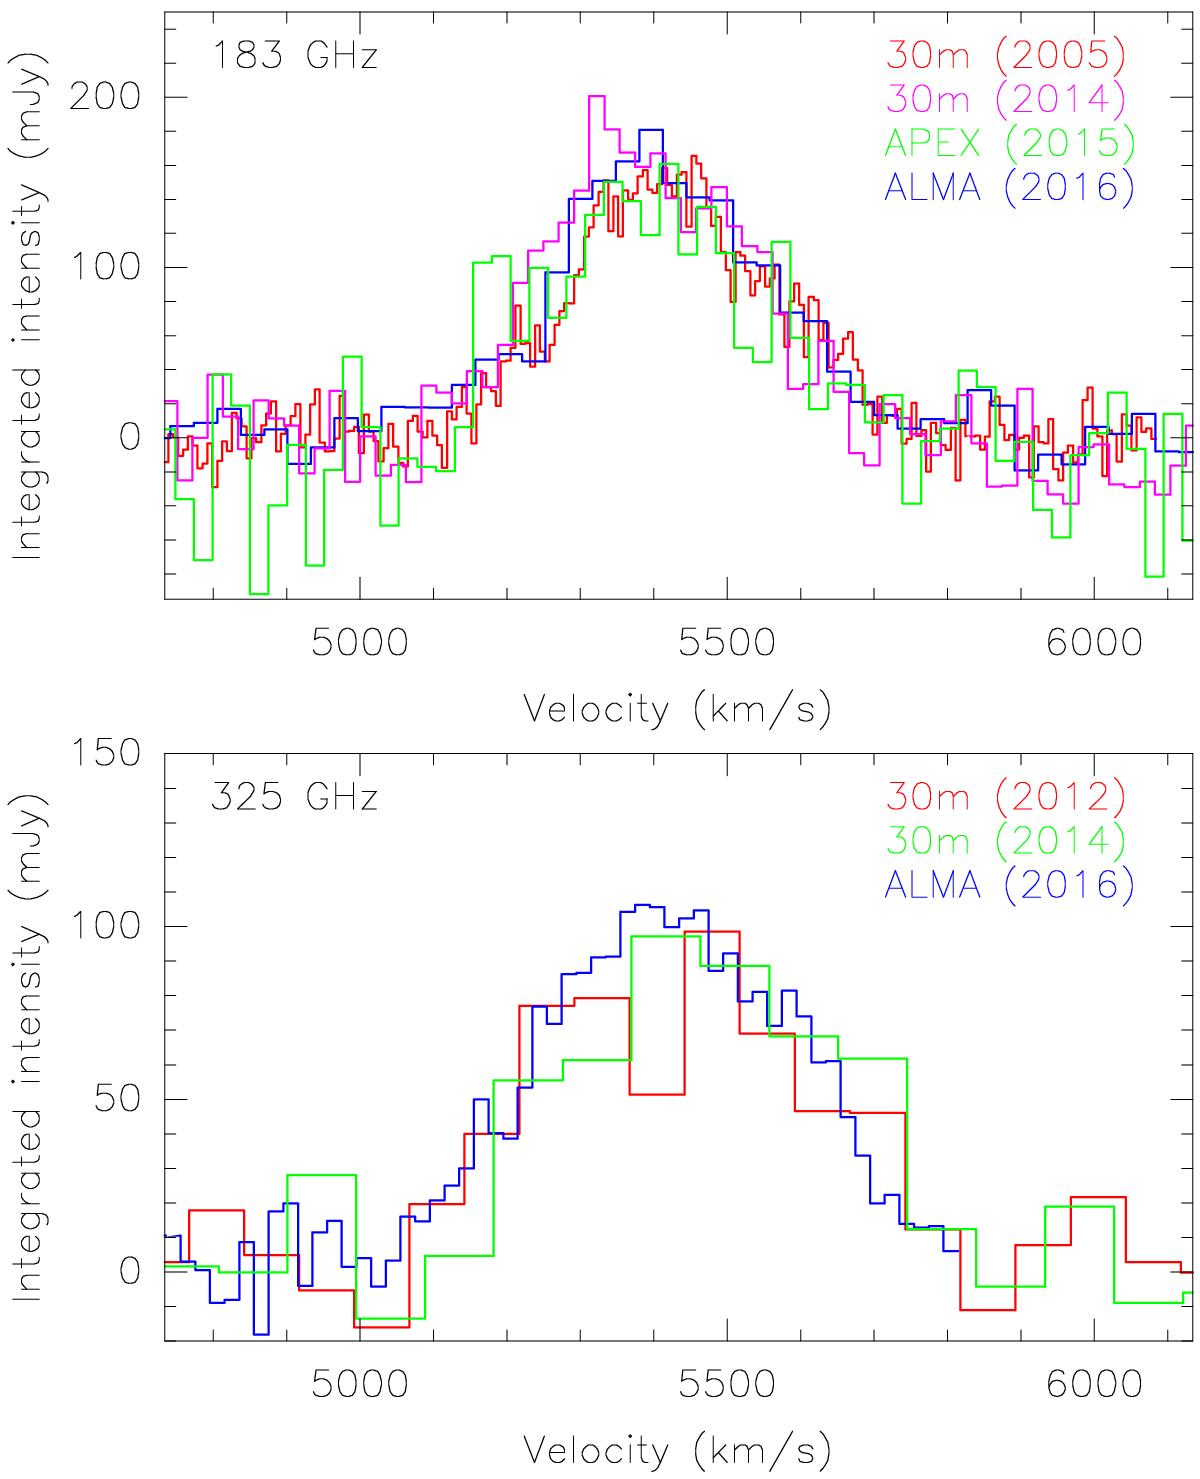
Comparison of the intensities and line shapes between previous single-dish observations (IRAM 30 m, APEX) and spatially smoothed ALMA observations at 183 and 325 GHz. The spectra are in good agreement within the errors imposed by the differences in the sensitivity of the used instruments.
This figure is made of several images, please see below:
Current usage metrics show cumulative count of Article Views (full-text article views including HTML views, PDF and ePub downloads, according to the available data) and Abstracts Views on Vision4Press platform.
Data correspond to usage on the plateform after 2015. The current usage metrics is available 48-96 hours after online publication and is updated daily on week days.
Initial download of the metrics may take a while.