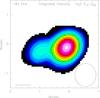
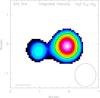
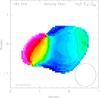
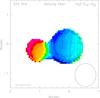
Fig. 2
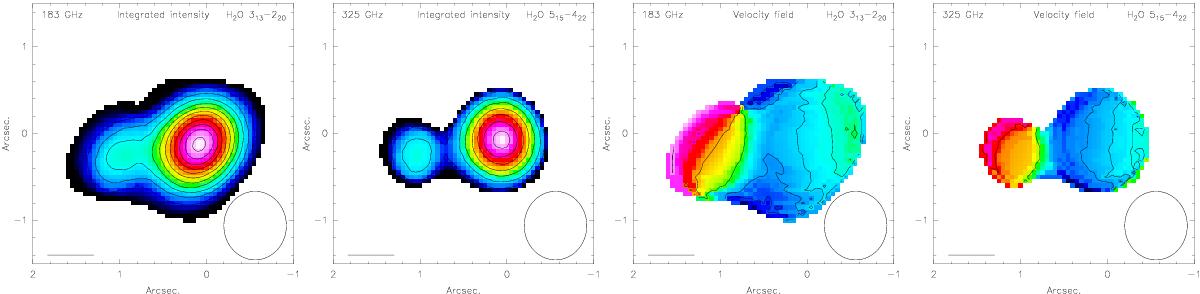
Maps of the integrated intensity distributions (left) and the velocity fields (right) of the 183 and 325 GHz water lines. Integrated intensity maps: phase center is located at Arp 220 West (α = 15:34:57.220, δ = +23:30:11.60). The contours start at 5σ and are spaced in steps of 10σ (1σ(183 GHz) = 3.9 mJy km s-1, 1σ(325 GHz) = 5.4 mJy km s-1). Velocity fields: color scale is identical for both lines (5200 km s-1–5600 km s-1) and the velocity contours start at 5280 km s-1 and are spaced in steps of 30 km s-1. North is up, east to the left. The beam (0.79′′ × 0.71′′) is indicated in the bottom right corner of each image. The bar in the lower left corner represents a spatial scale of 200 pc.
Current usage metrics show cumulative count of Article Views (full-text article views including HTML views, PDF and ePub downloads, according to the available data) and Abstracts Views on Vision4Press platform.
Data correspond to usage on the plateform after 2015. The current usage metrics is available 48-96 hours after online publication and is updated daily on week days.
Initial download of the metrics may take a while.