Fig. 1
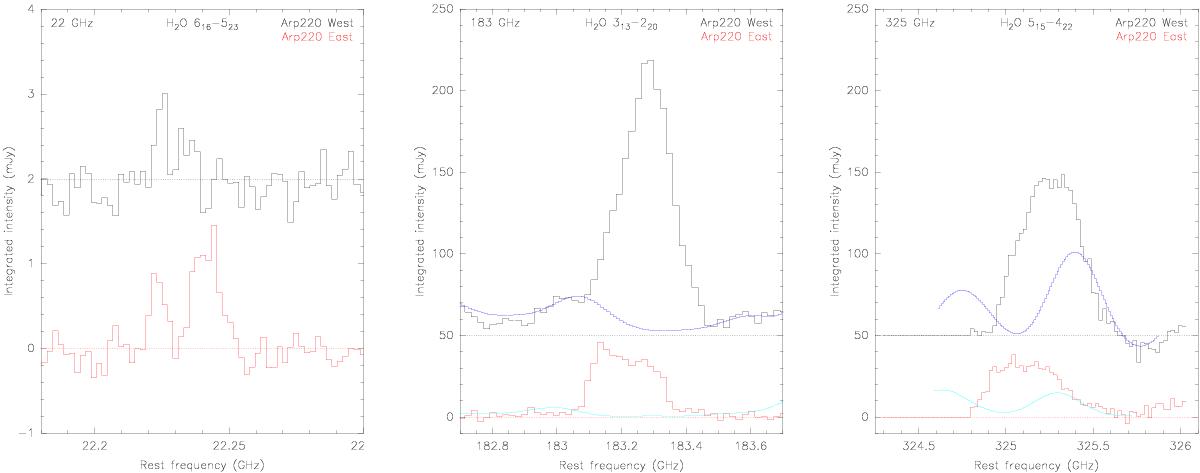
Water emission from Arp 220 West (black) and Arp 220 East (red) at 22 (left), 183 (center) and 325 GHz (right). The spectra were extracted from data convolved with the same beam of 0.79′′ × 0.71′′. An artificial offset in intensity was introduced to better show the spectra for each nucleus separately. The dotted lines show the zero-intensity levels. The 22 GHz spectrum has been corrected for contamination by the NH3 (3,1) absorption line. The dark and light blue curves in the 183 and 325 GHz spectra represent the synthetic spectrum used to evaluate the contamination of the water line by other emission lines (Martín et al., in prep.).
Current usage metrics show cumulative count of Article Views (full-text article views including HTML views, PDF and ePub downloads, according to the available data) and Abstracts Views on Vision4Press platform.
Data correspond to usage on the plateform after 2015. The current usage metrics is available 48-96 hours after online publication and is updated daily on week days.
Initial download of the metrics may take a while.