Free Access
Fig. 7
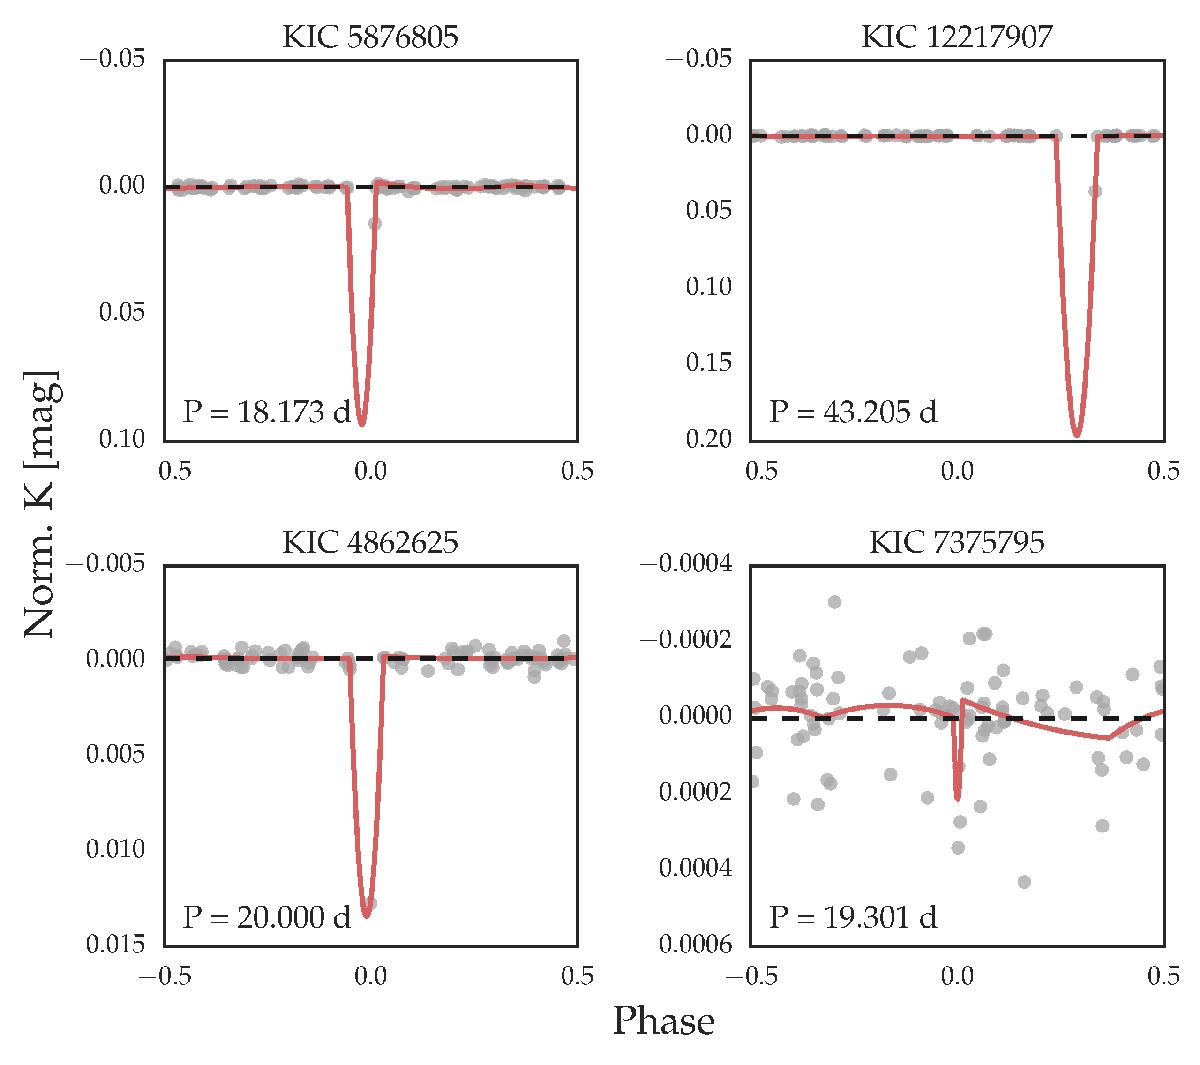
Examples of Gaia-sampled light curves where the polyfit model fits an eclipse, while the two-Gaussian does not. The plots show the observed Kepler light curve (gray dots) in normalized Kepler (K) magnitude, polyfit model (solid red line), and two-Gaussian model (dashed black line).
Current usage metrics show cumulative count of Article Views (full-text article views including HTML views, PDF and ePub downloads, according to the available data) and Abstracts Views on Vision4Press platform.
Data correspond to usage on the plateform after 2015. The current usage metrics is available 48-96 hours after online publication and is updated daily on week days.
Initial download of the metrics may take a while.