Fig. 3
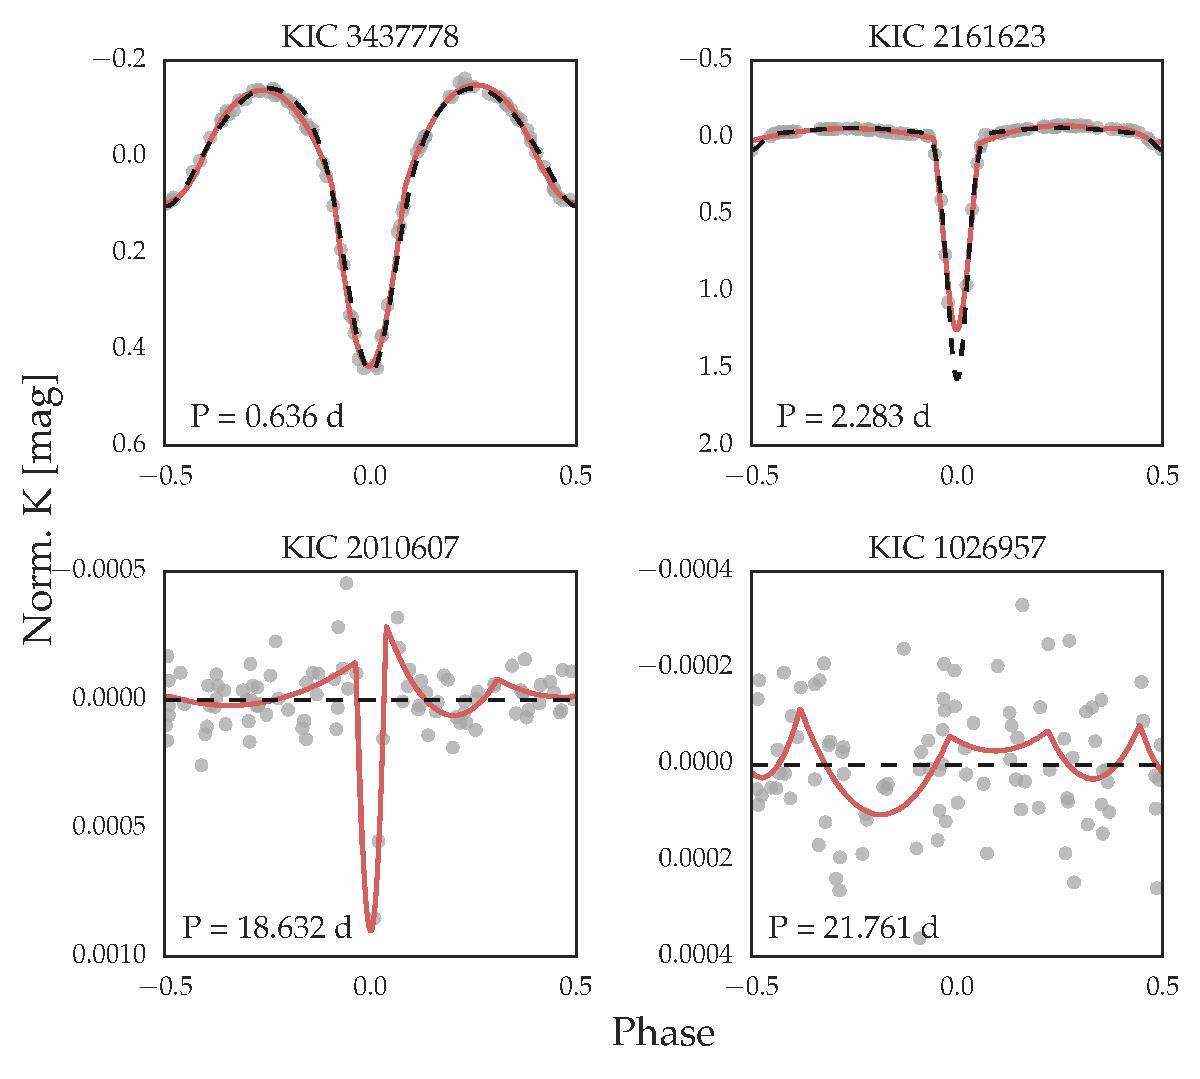
Same as Fig. 1, but for Gaia-sampled data. Top left: good quality data and both matching fits. Top right: good data, slightly discrepant fits. Bottom left: bad phase coverage in eclipse, the two-Gaussian model fits a constant model, while polyfits find eclipse. Bottom right: bad quality light curve and corresponding model fits.
Current usage metrics show cumulative count of Article Views (full-text article views including HTML views, PDF and ePub downloads, according to the available data) and Abstracts Views on Vision4Press platform.
Data correspond to usage on the plateform after 2015. The current usage metrics is available 48-96 hours after online publication and is updated daily on week days.
Initial download of the metrics may take a while.