Fig. 8
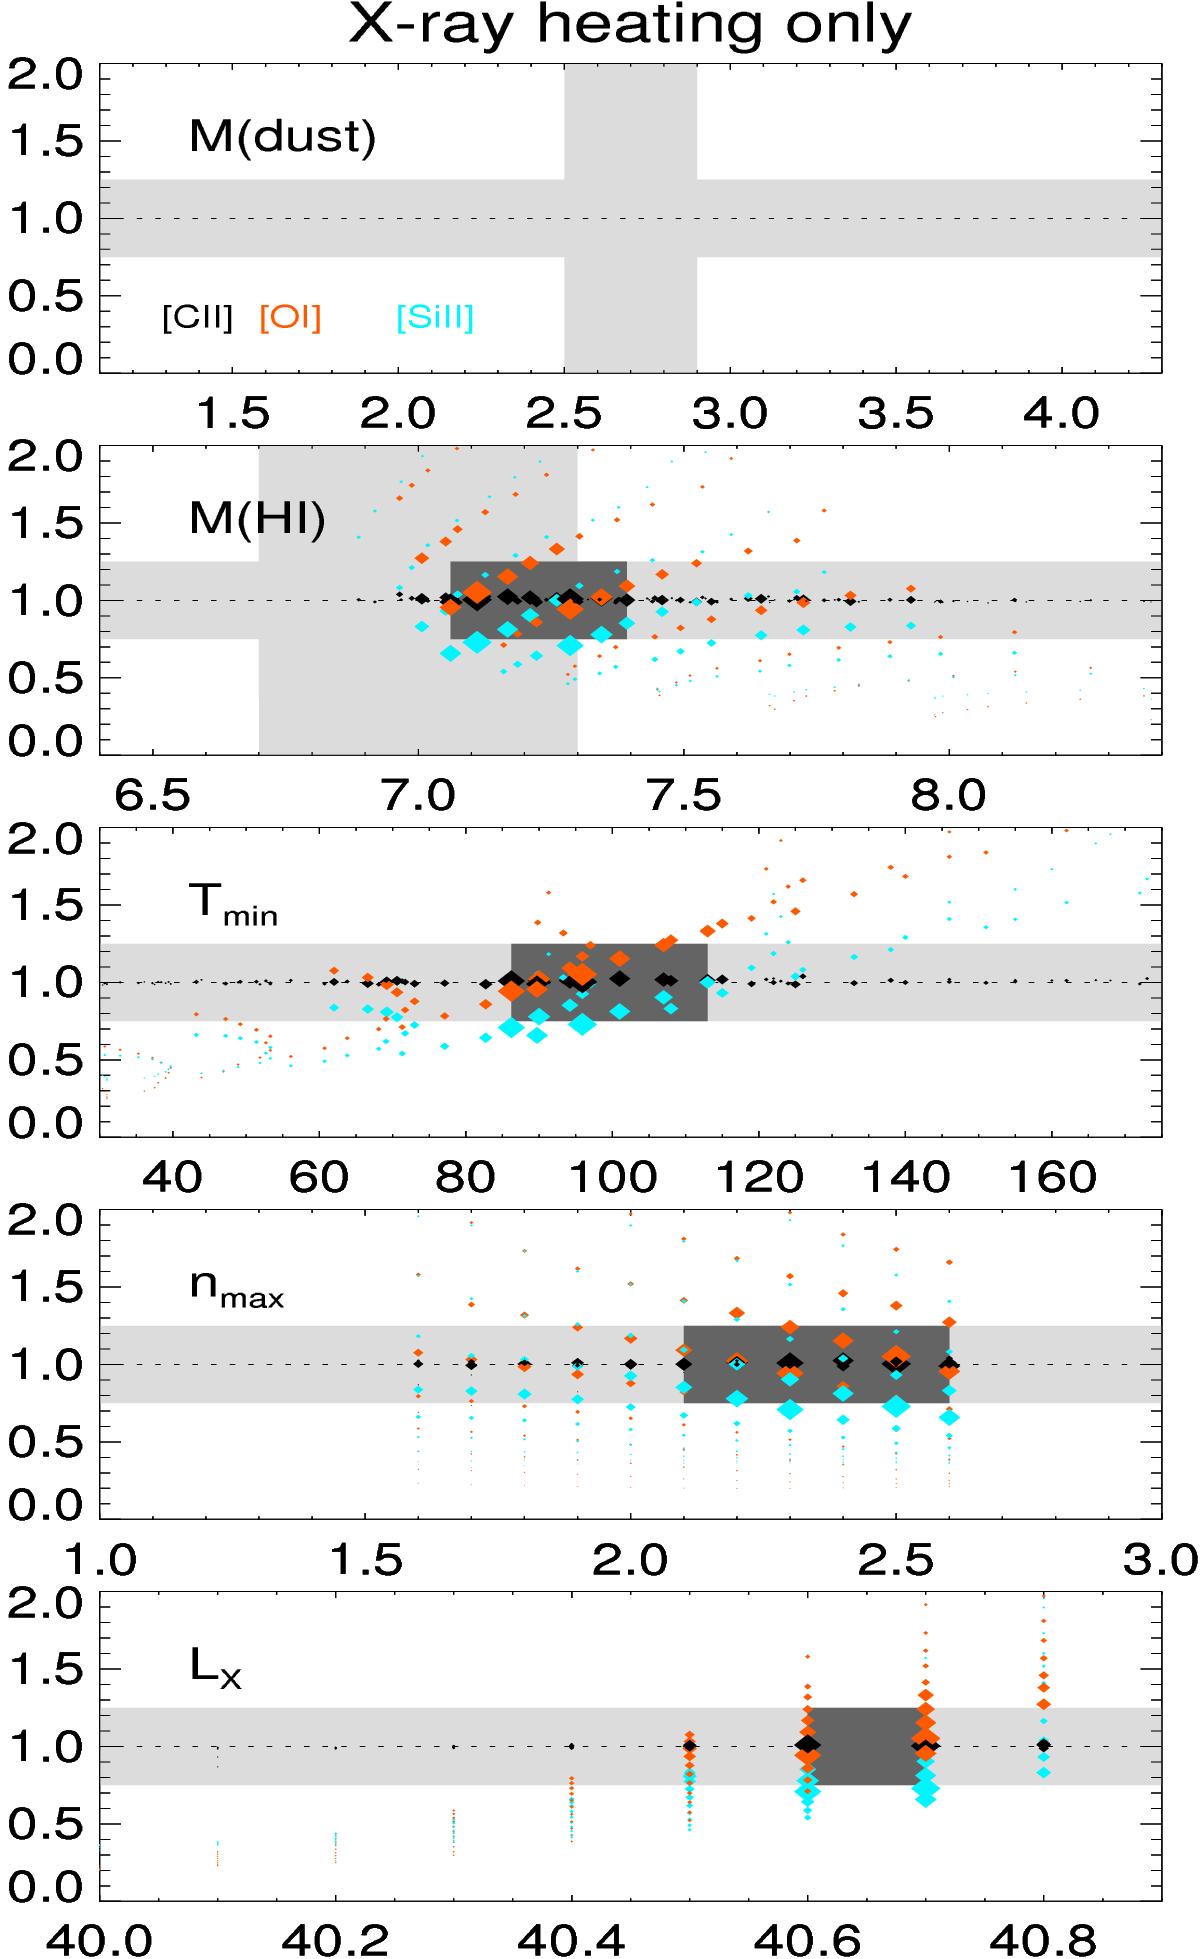
Exploration of models with X-ray heating only (no dust and no CR). The predicted line fluxes (model/observation) are plotted against each model parameter with from top to bottom, the dust mass and H0 mass (log M⊙), minimum temperature (K) and maximum density (log cm-3) in the radiation-bounded sector, and the X-ray luminosity (log L⊙). Each point represents a model, and the symbol size is inversely proportional to the residuals between model predictions and observations for [C ii], [O i], and [Si ii]. The light gray zone corresponds to the observed values and their associated error bar. The dark gray zone corresponds to the best models.
Current usage metrics show cumulative count of Article Views (full-text article views including HTML views, PDF and ePub downloads, according to the available data) and Abstracts Views on Vision4Press platform.
Data correspond to usage on the plateform after 2015. The current usage metrics is available 48-96 hours after online publication and is updated daily on week days.
Initial download of the metrics may take a while.