Fig. 7
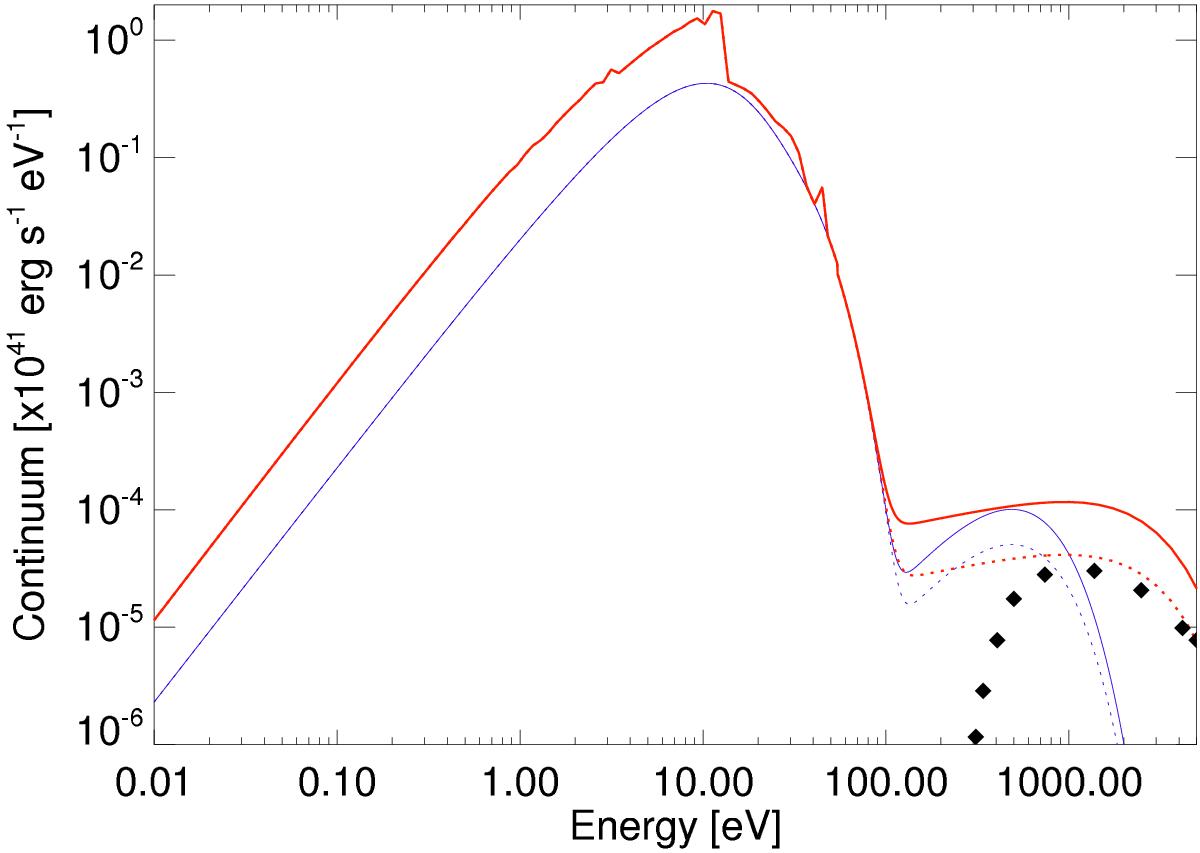
Blue curves show the input radiation field used in P08, comprised of three blackbodies with temperature 4 × 10⁴, 8 × 10⁴, and 2 × 10⁶ K. The dashed curve is for LX = 4 × 1039 erg s-1 (P08 model M2X) and the solid curve is for LX = 8 × 1039 erg s-1 (P08 model M2X2). The red curves show the radiation field used in this study, with additional UV-optical contribution (from Lebouteiller et al. 2013) and with an improved X-ray spectrum prescription as compared to P08. The dashed curve is for LX = 1.4 × 1040 erg s-1 (luminosity inferred from observations) and the solid curve is for LX = 4 × 1040 erg s-1 (adopted standard). The black diamonds show the unfolded XMM-Newton spectrum (see Sect. 5.3 for more details).
Current usage metrics show cumulative count of Article Views (full-text article views including HTML views, PDF and ePub downloads, according to the available data) and Abstracts Views on Vision4Press platform.
Data correspond to usage on the plateform after 2015. The current usage metrics is available 48-96 hours after online publication and is updated daily on week days.
Initial download of the metrics may take a while.