Fig. 5
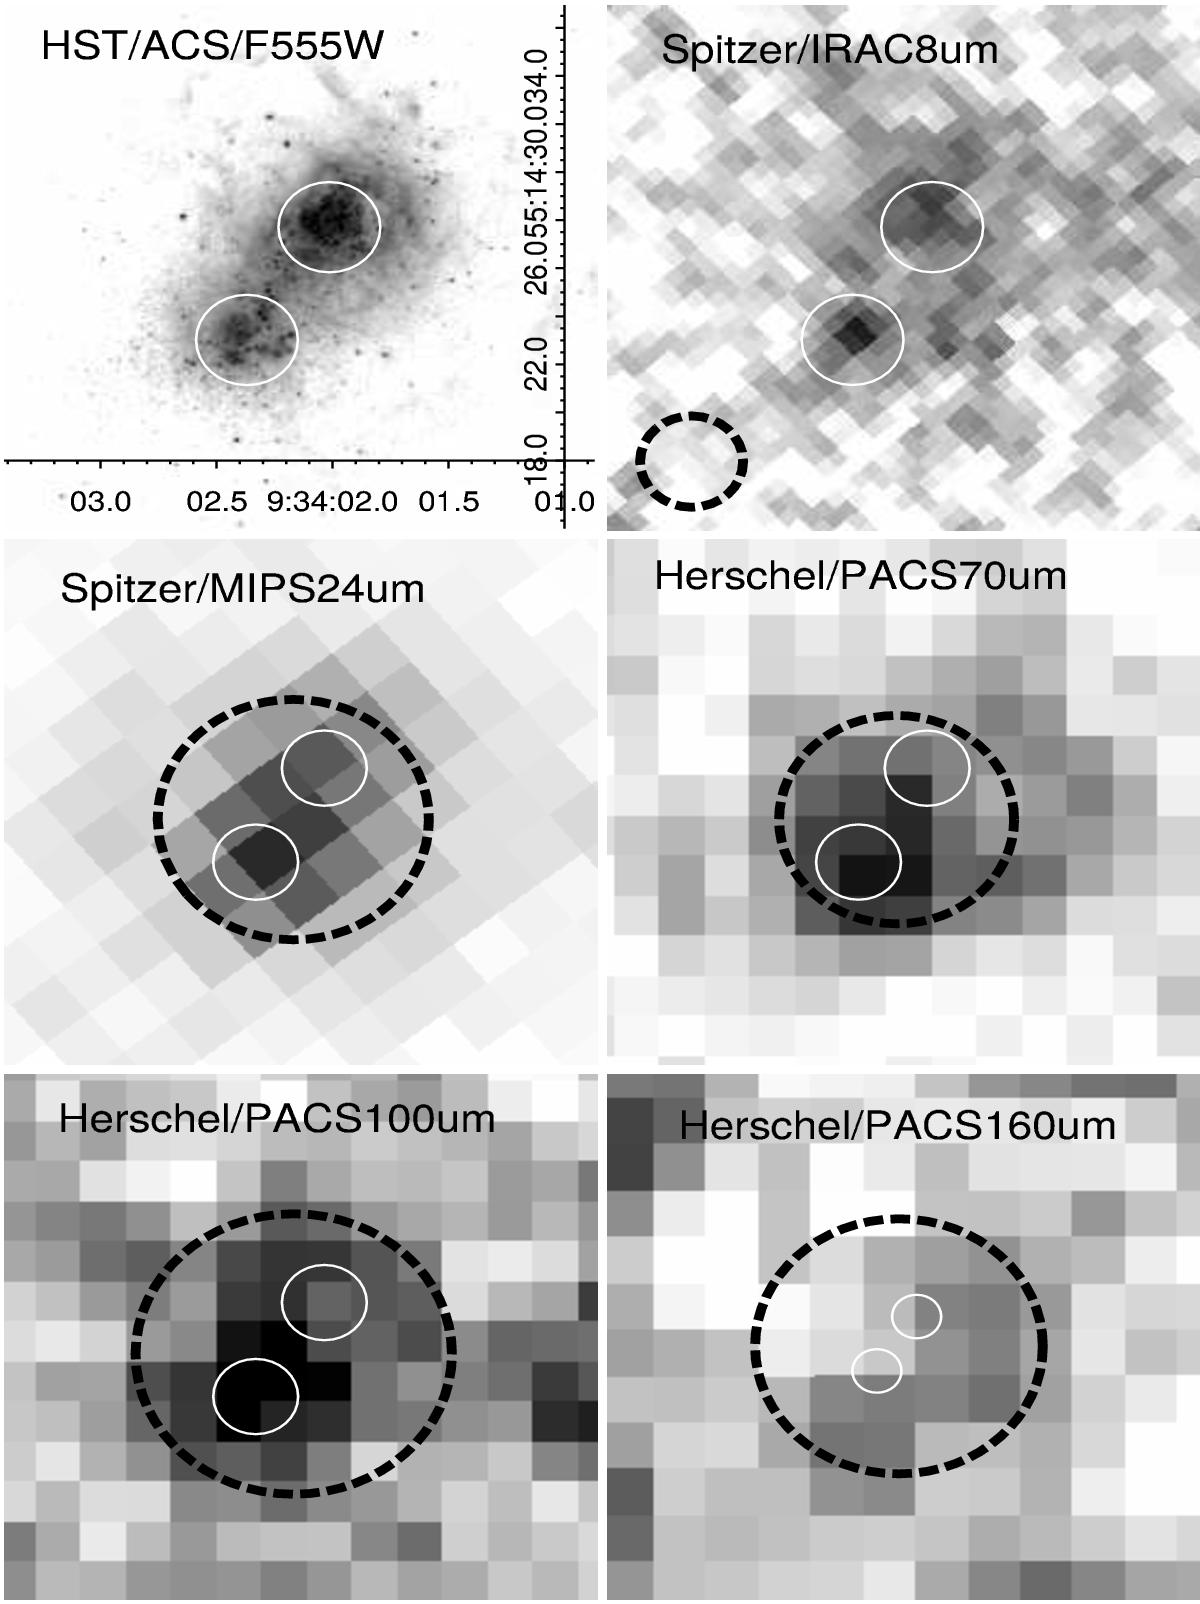
Photometric maps of I Zw 18 with Spitzer and Herschel (Rémy-Ruyer et al. 2015). The first panel shows the HST/ACS F555W image for reference, with the NW and SE regions circled in white. The dashed black circle indicates the beam size (from 2′′ for IRAC 8 μm to 12′′ for PACS 160 μm). The 8 μm band is not dominated by PAH emission in I Zw 18 but by stochastically heated small grains and warm grains in thermal equilibrium with the interstellar radiation field.
Current usage metrics show cumulative count of Article Views (full-text article views including HTML views, PDF and ePub downloads, according to the available data) and Abstracts Views on Vision4Press platform.
Data correspond to usage on the plateform after 2015. The current usage metrics is available 48-96 hours after online publication and is updated daily on week days.
Initial download of the metrics may take a while.