Fig. 4
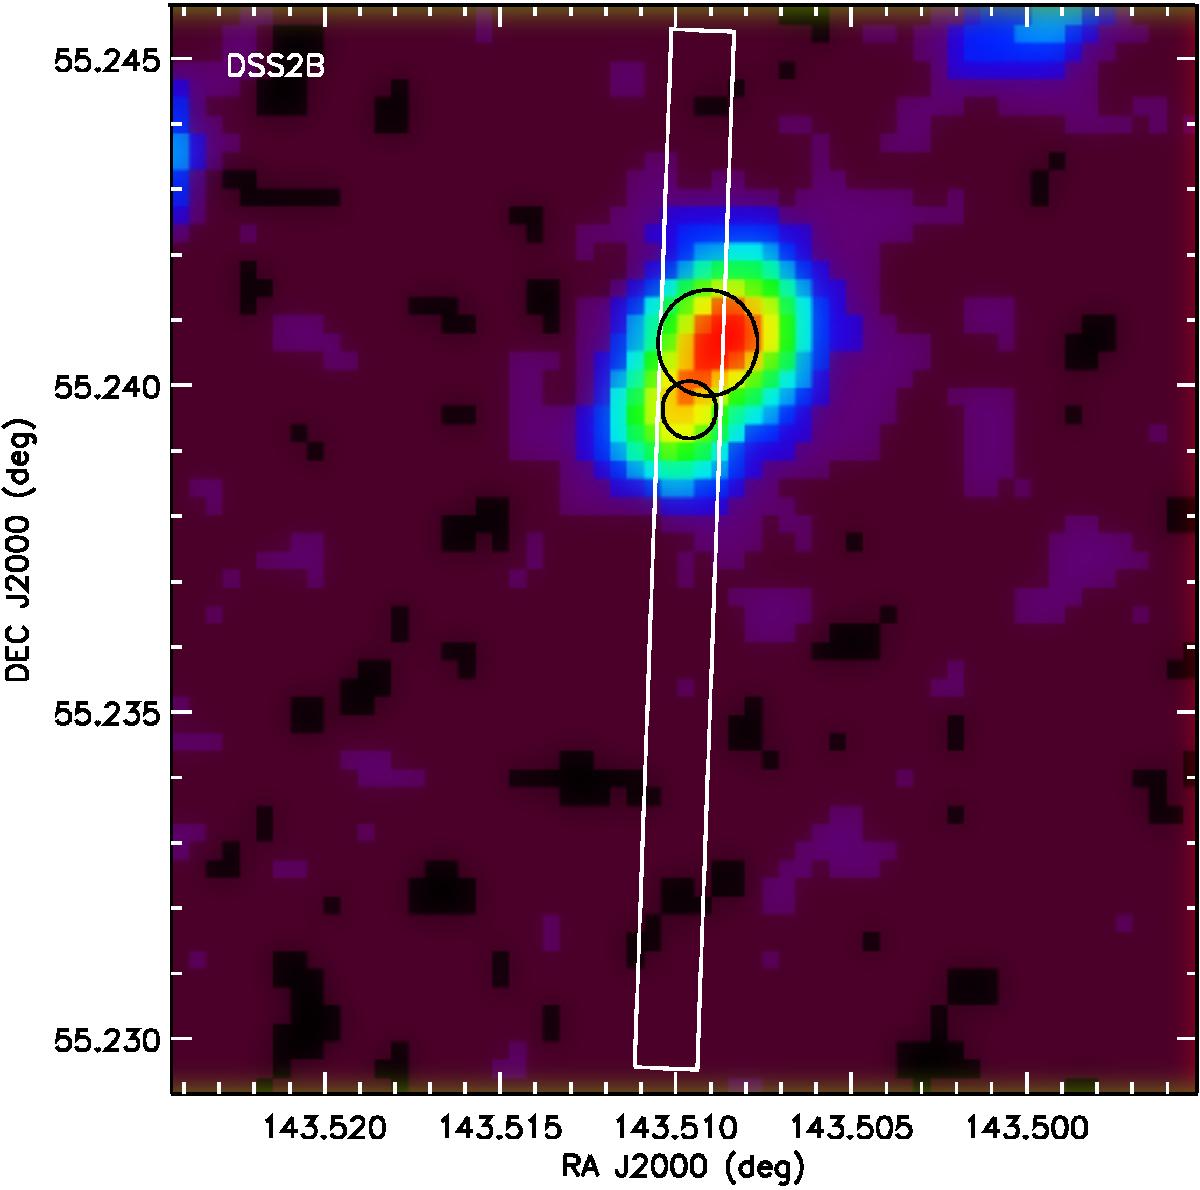
Spatial positions of the two components seen in the IRS SL slit. The slit is shown with the white rectangle and the circles indicate the locations of the sources shown in Fig. 3. The size of the circles corresponds to the total FWHM of each source (i.e., including both the instrument PSF and the intrinsic broadening). The background image is the B band from the DSS2 survey.
Current usage metrics show cumulative count of Article Views (full-text article views including HTML views, PDF and ePub downloads, according to the available data) and Abstracts Views on Vision4Press platform.
Data correspond to usage on the plateform after 2015. The current usage metrics is available 48-96 hours after online publication and is updated daily on week days.
Initial download of the metrics may take a while.