Fig. 3
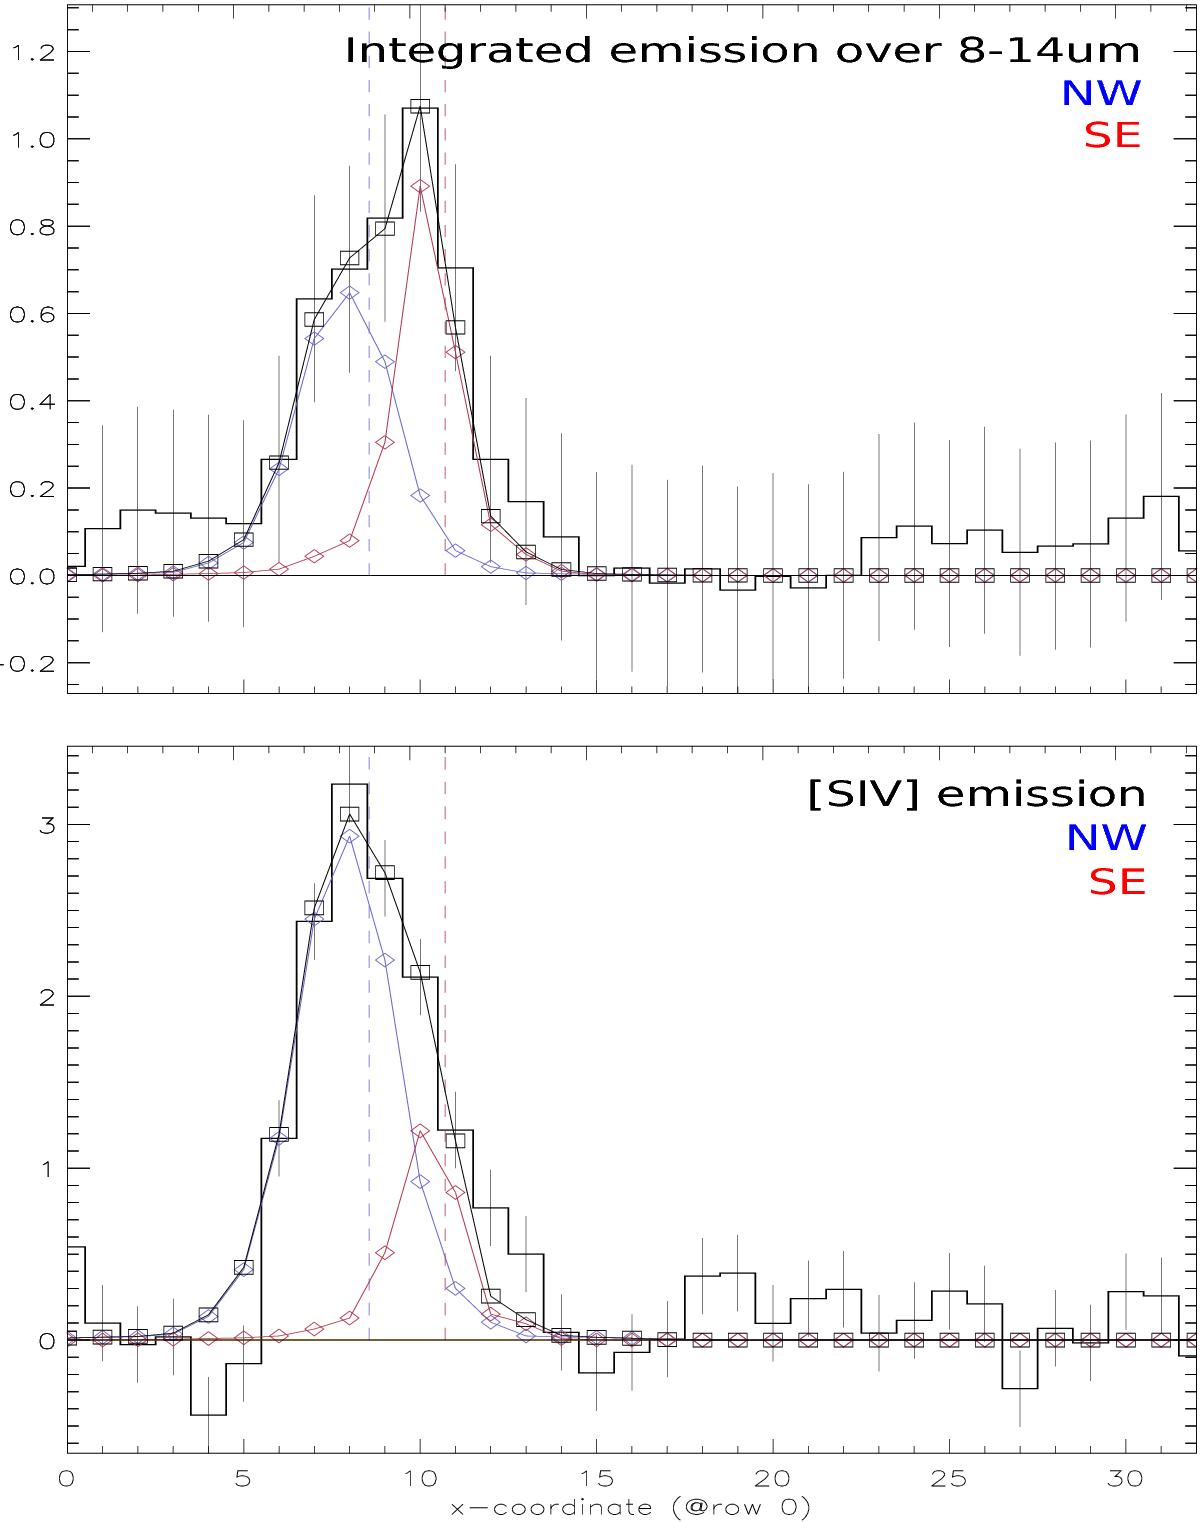
Cross-dispersion profiles along the SL slit of the Spitzer/IRS observation 16205568. The histogram shows the emission as a function of the spatial position along the slit, in pixel units (1 px = 1.8′′). The spatial profile is modeled by two slightly extended sources, one of which corresponds to NW (blue, left) and the other to SE (red, right). The profile is shown for the entire integrated spectral order of module SL1 (~8−14 μm; top) and for the [S iv] 10.5 μm line only (bottom). Left corresponds to north in Fig. 4.

Current usage metrics show cumulative count of Article Views (full-text article views including HTML views, PDF and ePub downloads, according to the available data) and Abstracts Views on Vision4Press platform.
Data correspond to usage on the plateform after 2015. The current usage metrics is available 48-96 hours after online publication and is updated daily on week days.
Initial download of the metrics may take a while.