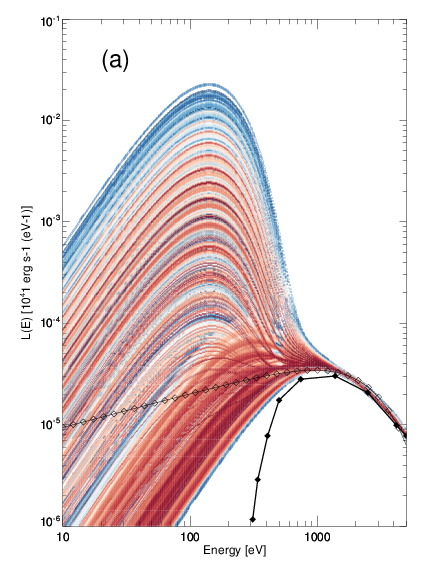
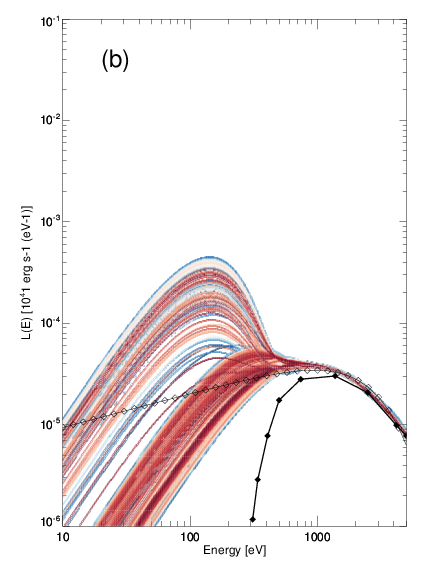
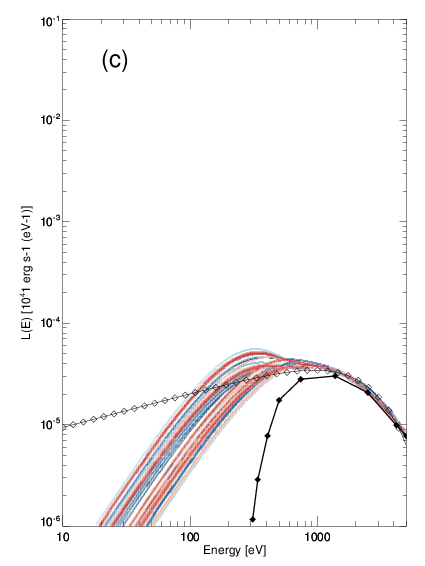
Fig. C.2
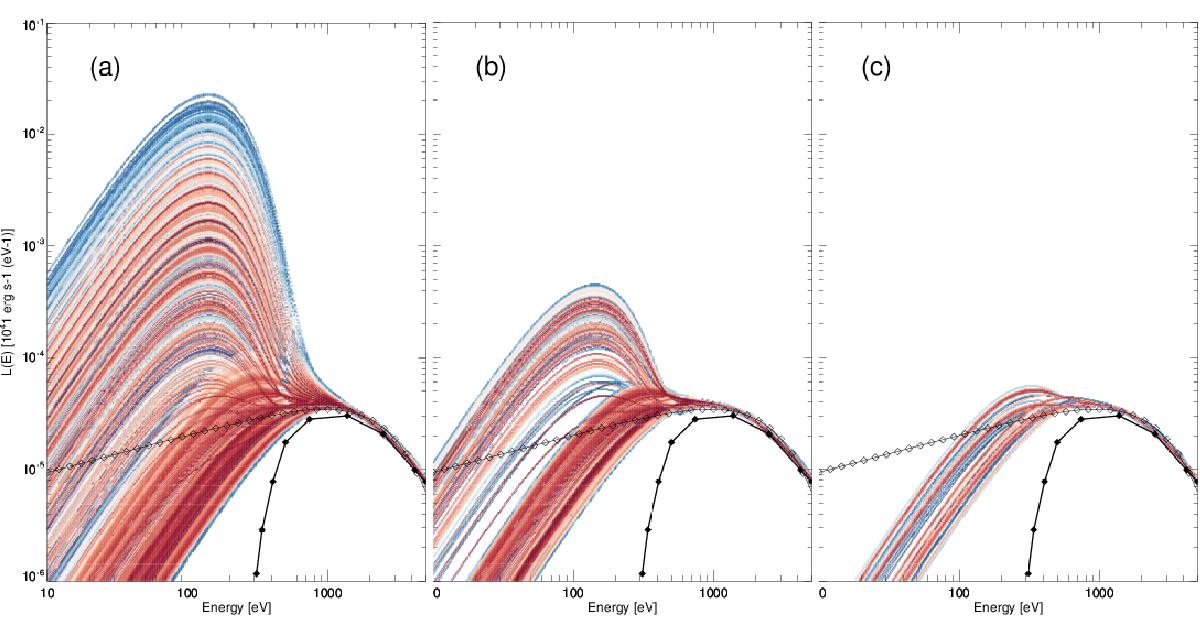
Test of the 4-blackbody combinations with xspec. The open diamonds show the diskbb model while the filled diamonds show the XMM-Newton unfolded spectrum. The set of best blackbody combinations with column density <1022 cm-2 are shown in panel a). A subset with column densities between 1−2.5 × 1021 cm-2 is shown in panel b). Only in the combinations left in panel c) are the associated photoionization models fulfilling the observed upper limit on the [Ne v] flux. For simplicity, we plot the X-ray spectra of panel c) with the same luminosity as for the other panels, but in reality an increased luminosity is used, according to Sect. 5.3. In each panel, the colors indicate the relative variation of the χ2 among the plotted combinations (lower χ2 in red, larger χ2 in blue).
Current usage metrics show cumulative count of Article Views (full-text article views including HTML views, PDF and ePub downloads, according to the available data) and Abstracts Views on Vision4Press platform.
Data correspond to usage on the plateform after 2015. The current usage metrics is available 48-96 hours after online publication and is updated daily on week days.
Initial download of the metrics may take a while.