Fig. C.1
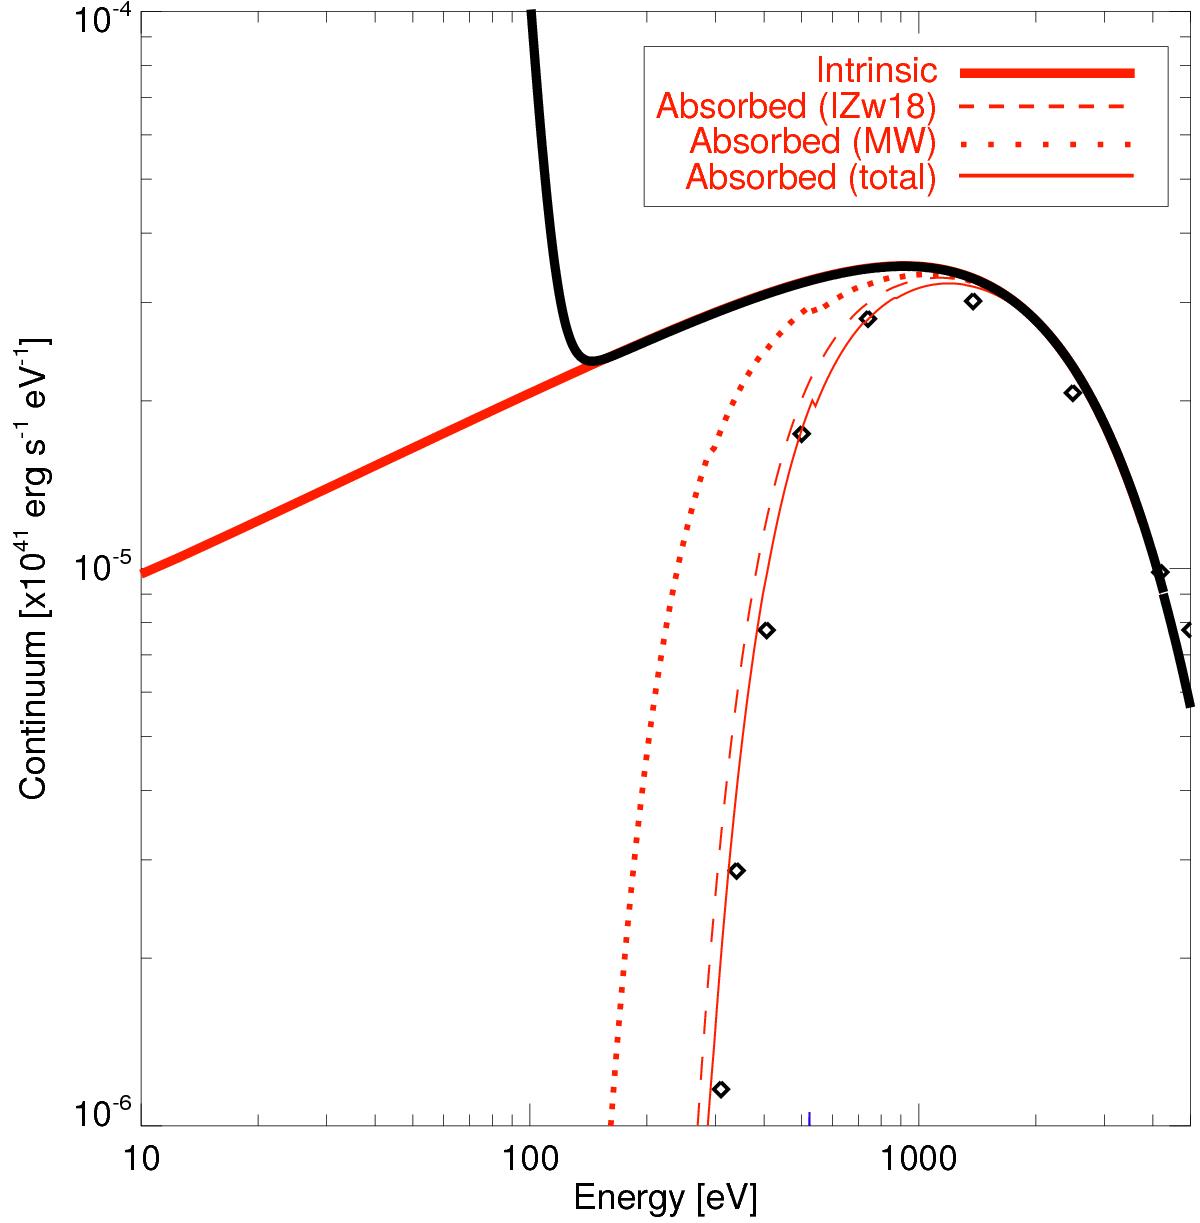
X-ray spectrum of I Zw 18. The X-ray emission is calculated with a diskbb model (distribution of blackbodies from an accretion disk). The diamonds show the unfolded XMM-Newton spectrum. The dashed red line shows the spectrum absorbed by I Zw 18 alone while the dotted red line shows the spectrum absorbed by the Milky Way alone. The top red solid line shows the intrinsic (unabsorbed) X-ray spectrum. The thick black curve shows the sum of the radiation field components (two blackbodies in the optical and the X-ray source).
Current usage metrics show cumulative count of Article Views (full-text article views including HTML views, PDF and ePub downloads, according to the available data) and Abstracts Views on Vision4Press platform.
Data correspond to usage on the plateform after 2015. The current usage metrics is available 48-96 hours after online publication and is updated daily on week days.
Initial download of the metrics may take a while.