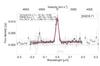
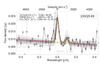
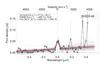
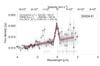
Fig. B.2
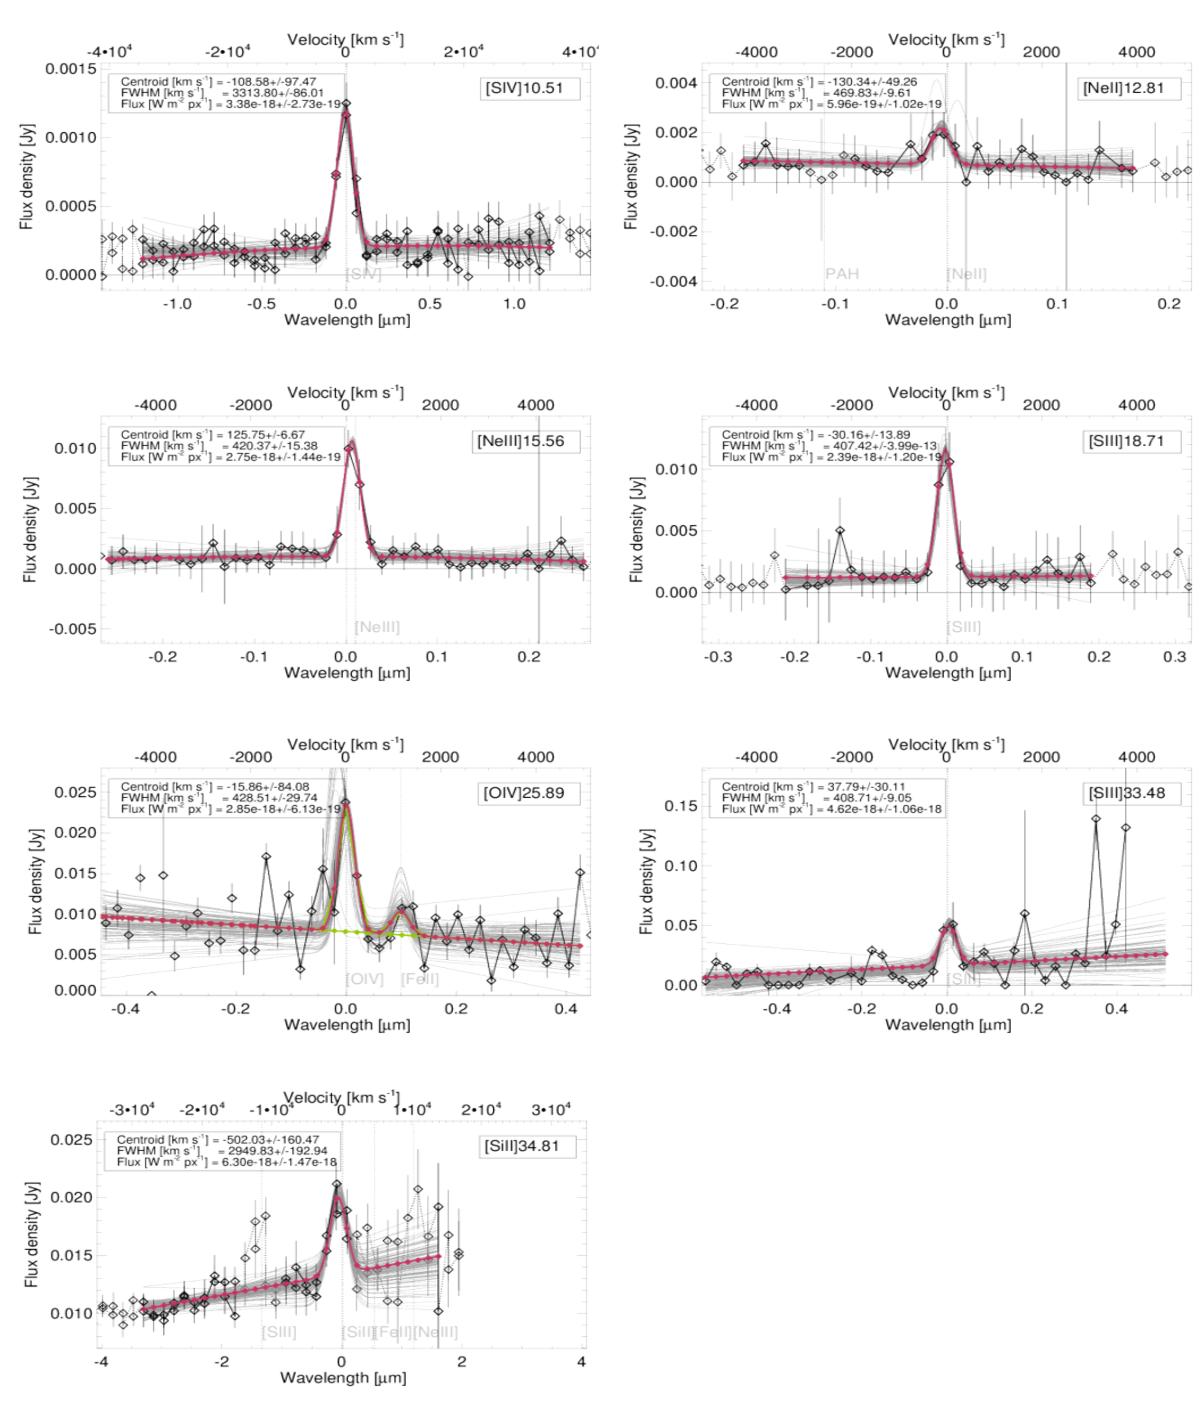
Spectral fits for the most important lines used in this study. Several spectra are available for each Spitzer/IRS line in both low- and high-resolution modes with line widths of ~3000 km s-1 and ~400 km s-1 respectively. We selected one spectrum per line for illustrative purposes. The diamonds show the data and the connected diamonds represent the range used for fitting the line. The many light gray curves show Monte-Carlo iterations for determining the line flux uncertainty. The red curve shows the final fit.
Current usage metrics show cumulative count of Article Views (full-text article views including HTML views, PDF and ePub downloads, according to the available data) and Abstracts Views on Vision4Press platform.
Data correspond to usage on the plateform after 2015. The current usage metrics is available 48-96 hours after online publication and is updated daily on week days.
Initial download of the metrics may take a while.