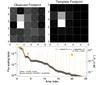
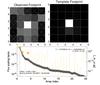
Fig. A.3
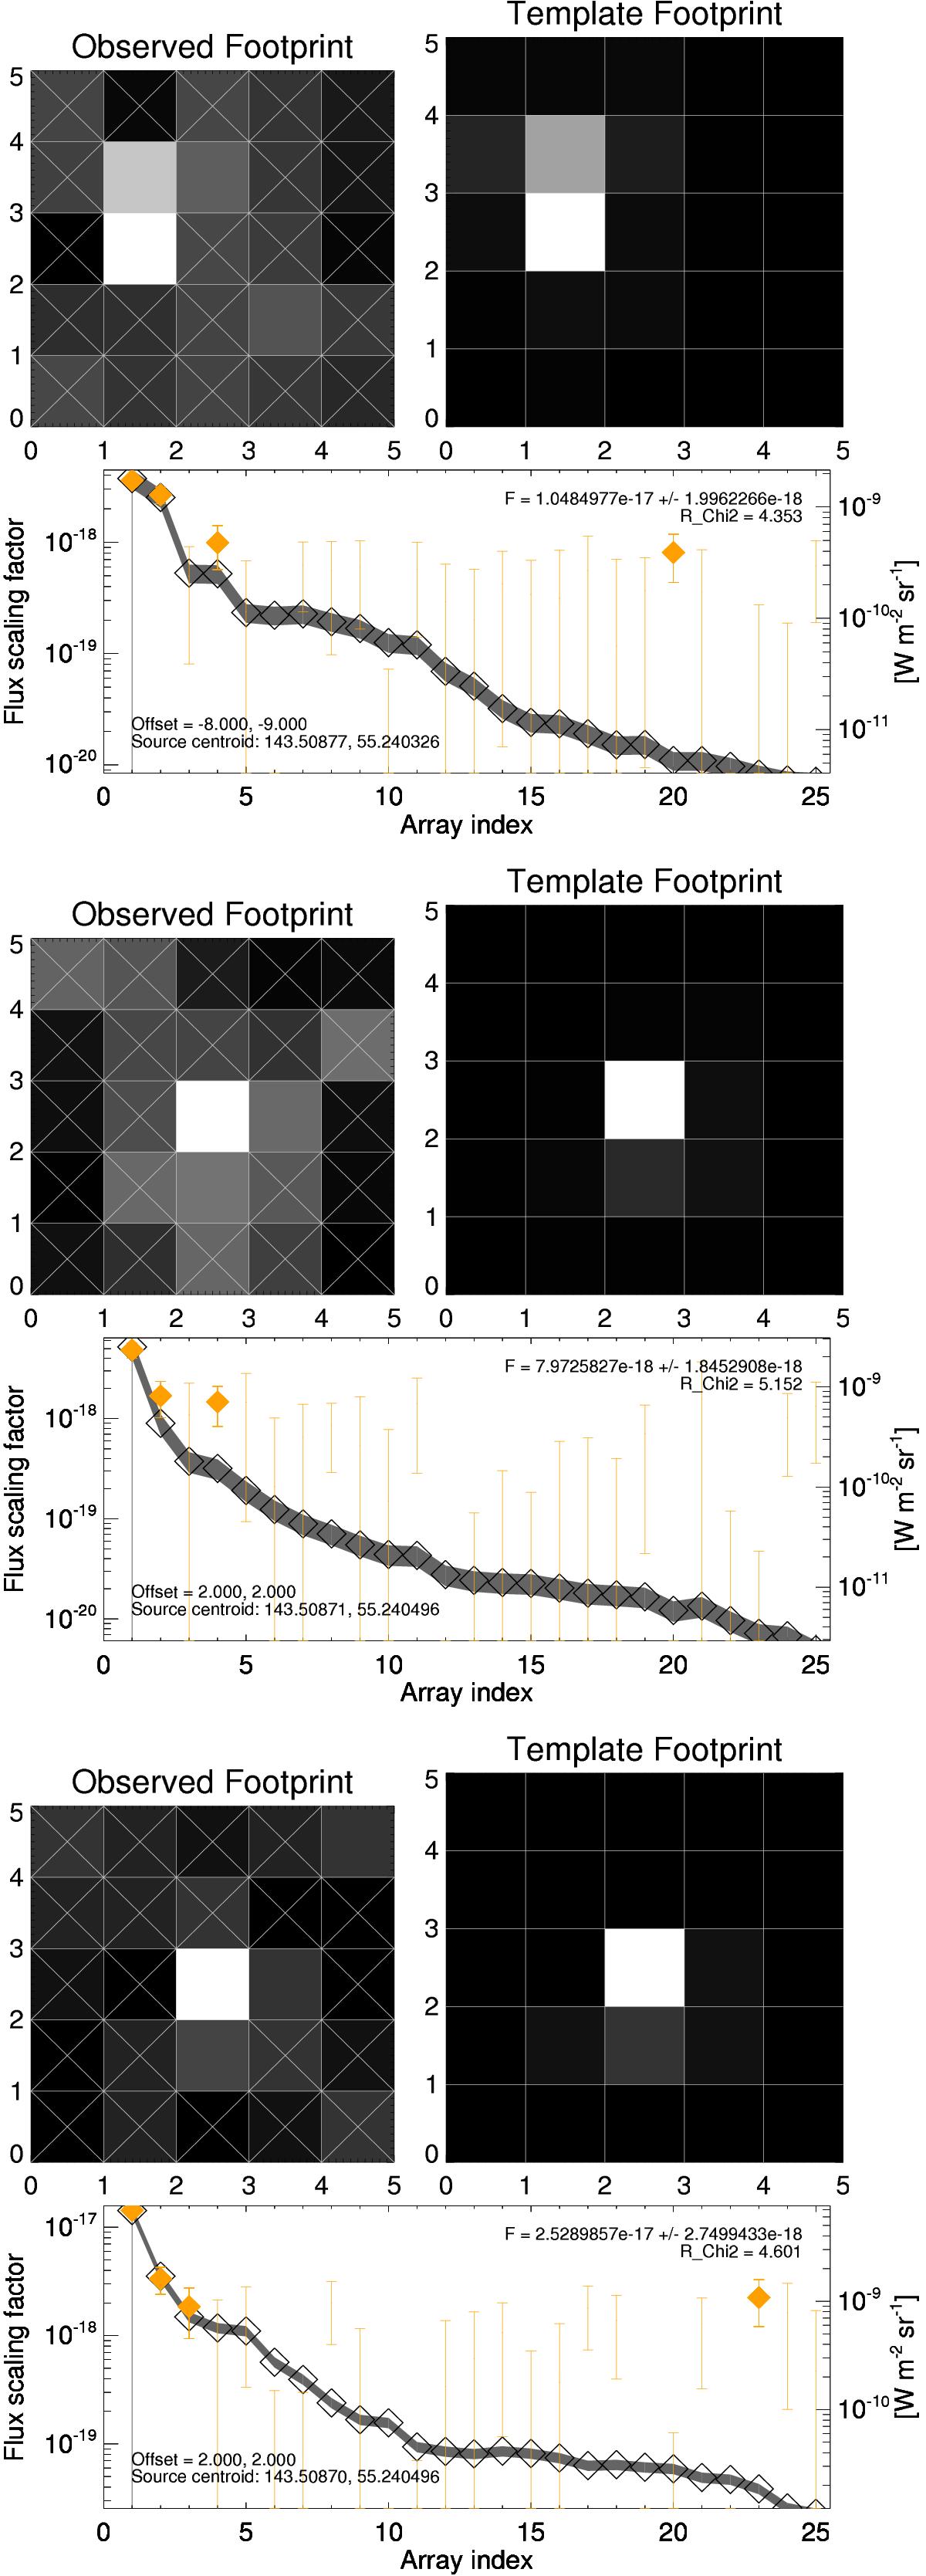
Optimal extraction of [C ii] (top), [O i] (middle), and [O iii] (bottom). For each line the top panel shows the observed footprint (with crossed spaxels indicating non-detection) and the template footprint (chosen from a library of precomputed projected PSFs). The footprint is shown as a regular grid for display purposes only; in reality, the spaxels are not uniform in size and one row is shifted with respect to the others. The bottom panel shows the spaxel fluxes ordered by flux. Observed values are indicated in orange. The theoretical distribution from the template footprint is shown with the black curve. The 3 brightest spaxels suffice to locate the peak.
Current usage metrics show cumulative count of Article Views (full-text article views including HTML views, PDF and ePub downloads, according to the available data) and Abstracts Views on Vision4Press platform.
Data correspond to usage on the plateform after 2015. The current usage metrics is available 48-96 hours after online publication and is updated daily on week days.
Initial download of the metrics may take a while.