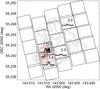
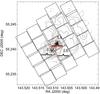
Fig. 2
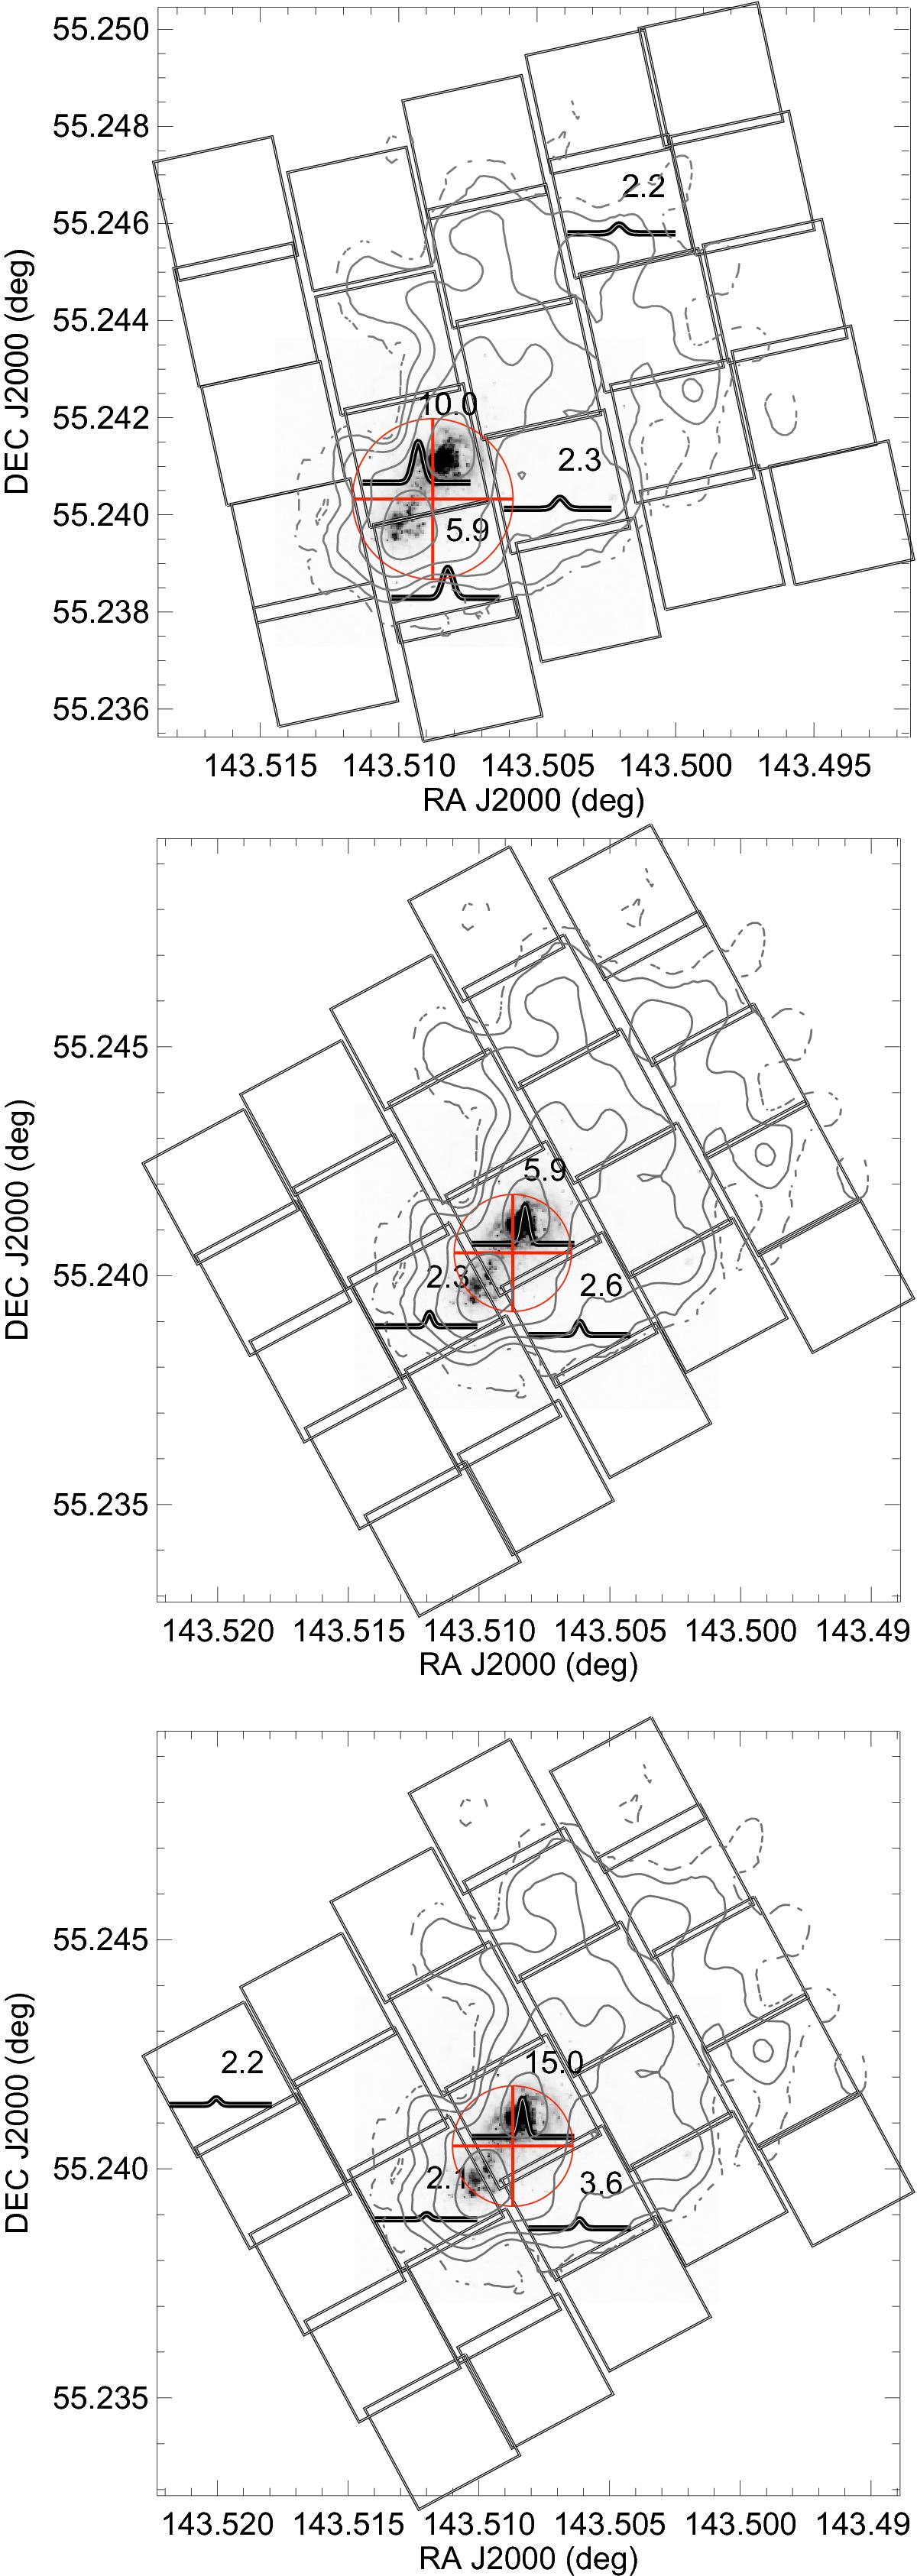
Herschel/PACS map of [C ii] (top), [O i] (middle), and [O iii] (bottom) emission in I Zw 18. The 25 spaxels of the PACS footprint are overplotted on the F555W HST/ACS image. The contours show the H i column density at 5″ resolution (Lelli et al. 2012). For display purposes, only the fits are shown for each spaxel with detection level >2σ, and the number indicates the detection level in σ. The red circle shows the beam size and the red cross shows the emission centroid as calculated by the optimal extraction (Sect. 3.1.2). Individual spaxel spectra are presented in Appendix A.1.
Current usage metrics show cumulative count of Article Views (full-text article views including HTML views, PDF and ePub downloads, according to the available data) and Abstracts Views on Vision4Press platform.
Data correspond to usage on the plateform after 2015. The current usage metrics is available 48-96 hours after online publication and is updated daily on week days.
Initial download of the metrics may take a while.