Fig. A.1
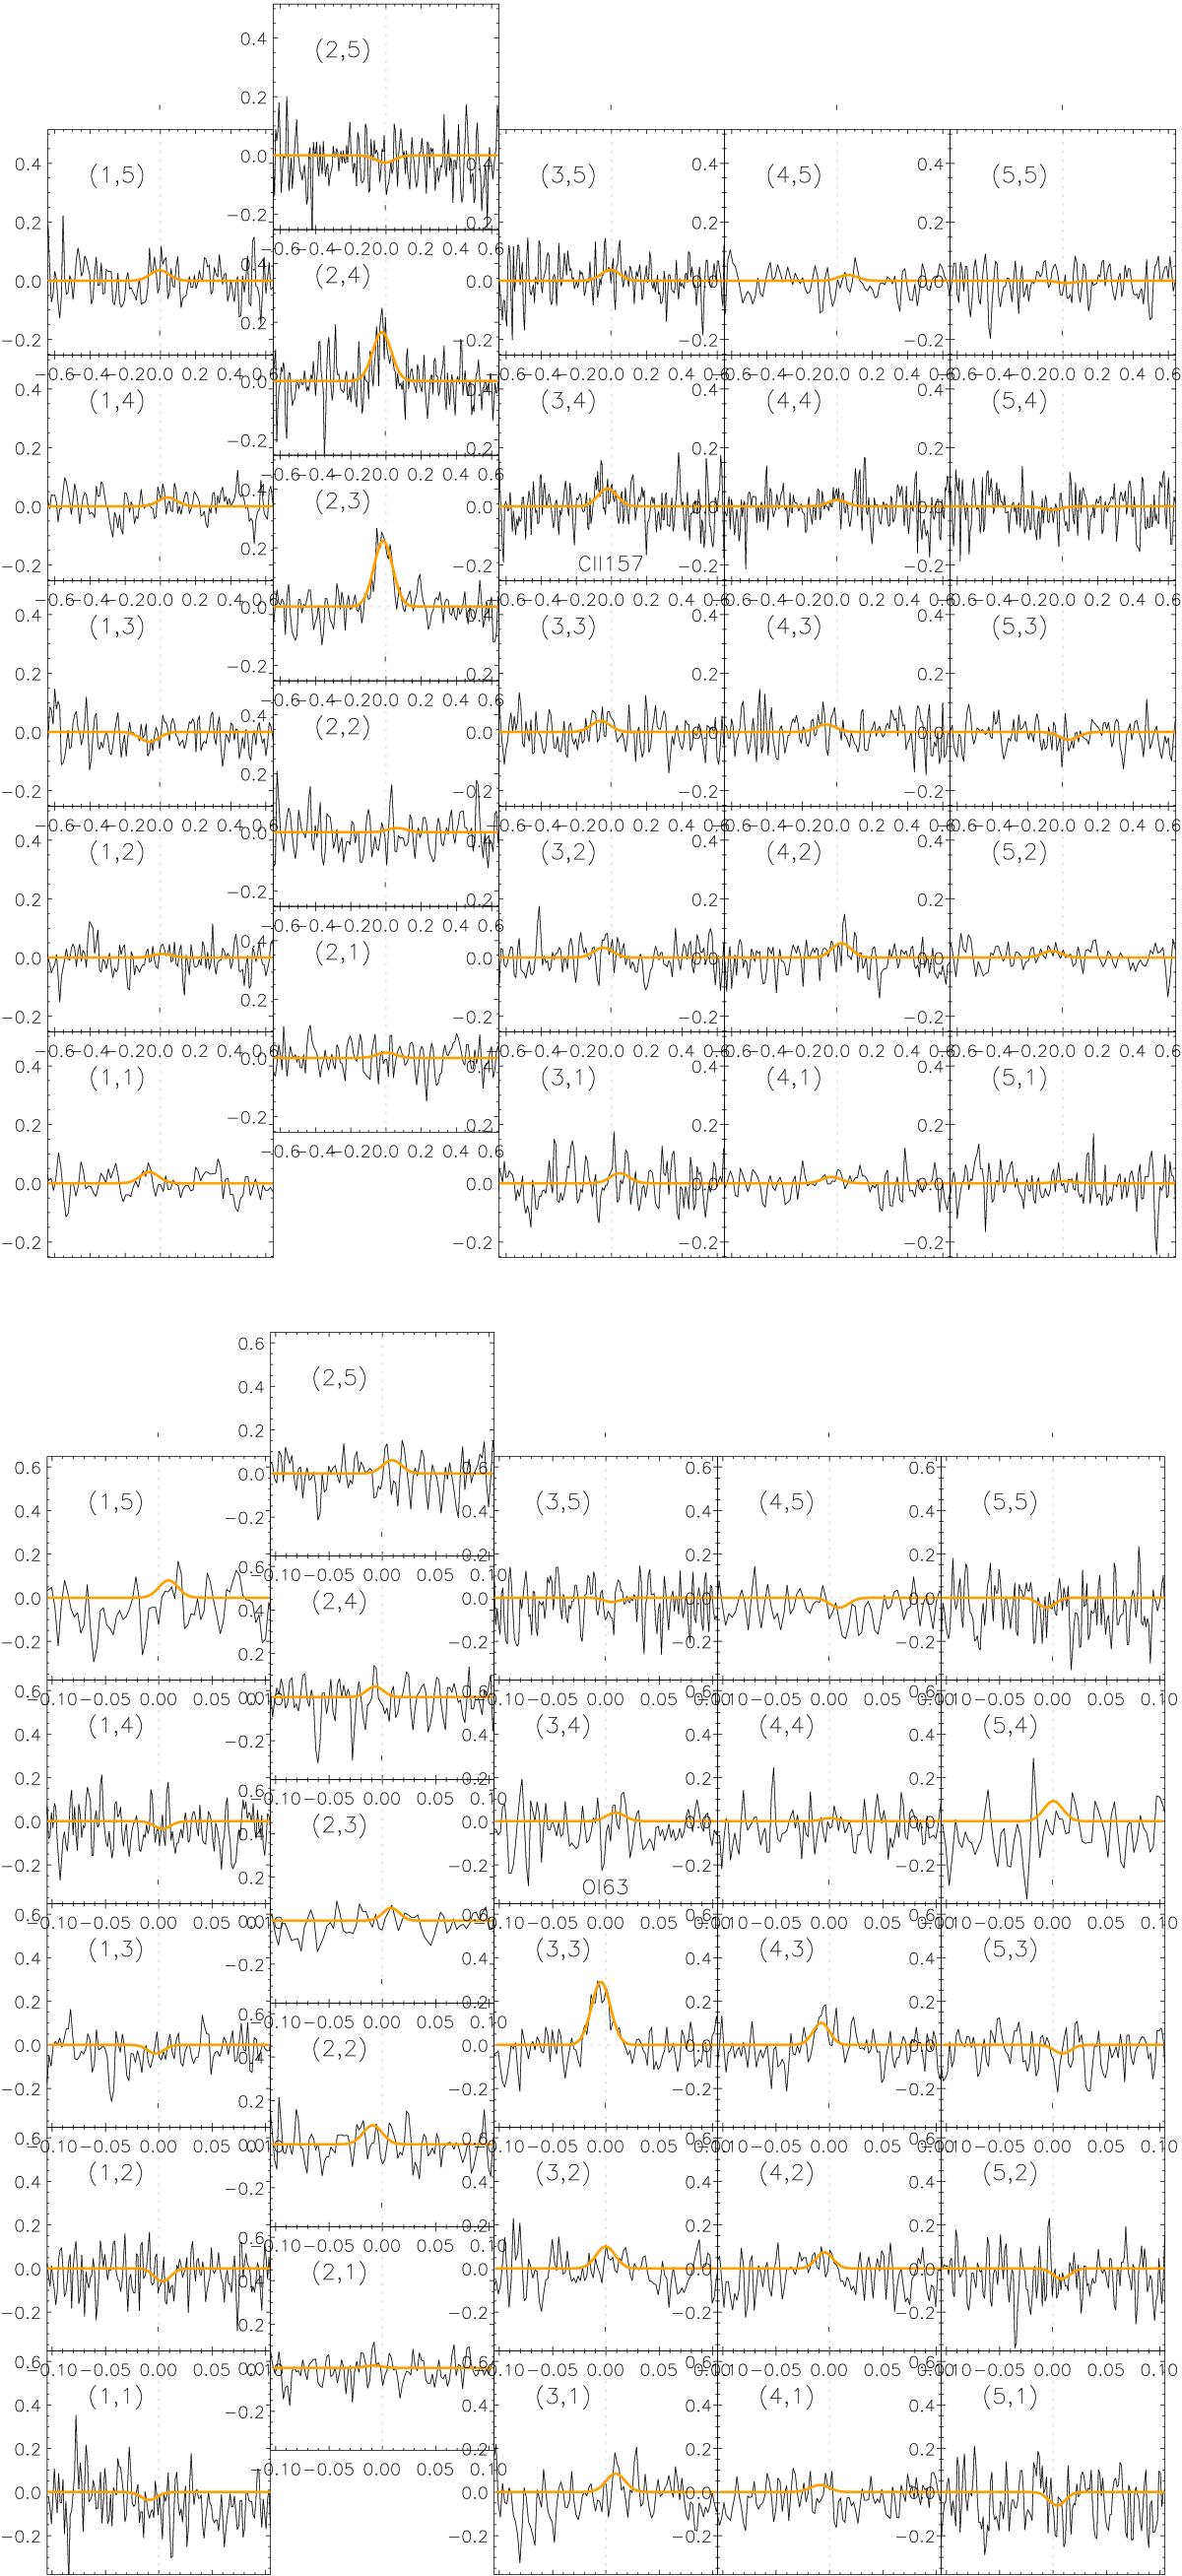
Individual Herschel/PACS spaxel background-subtracted spectra for [C ii] 157 μm (top) and [O i] 63 μm (bottom). The observed spectrum is shown in black while the line fit is shown in orange. The number between parentheses indicates the spaxel coordinate within the footprint. The second column is shifted to reflect the PACS footprint projection on the sky.
Current usage metrics show cumulative count of Article Views (full-text article views including HTML views, PDF and ePub downloads, according to the available data) and Abstracts Views on Vision4Press platform.
Data correspond to usage on the plateform after 2015. The current usage metrics is available 48-96 hours after online publication and is updated daily on week days.
Initial download of the metrics may take a while.