Fig. 1
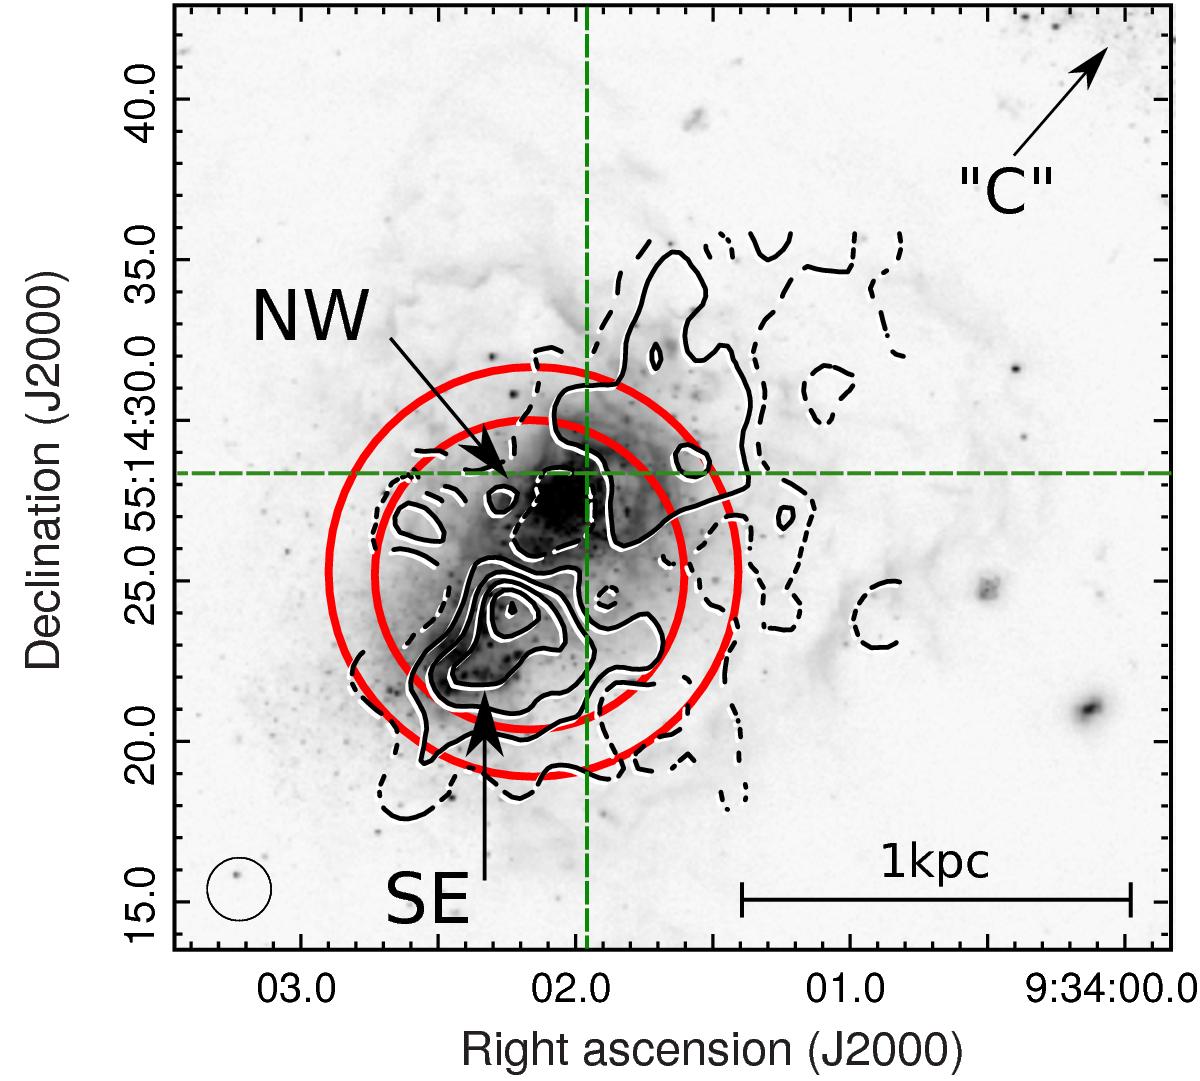
H i column density contours from Lelli et al. (2012), with 2′′ resolution (beam size in the bottom left). Contours are drawn for 3 (dashed), 6, 9, 12, and 15 × 1021 cm-2. The largest red circle shows the PACS beam at 157 μm ([C ii]) and the smallest red circle shows the beam at 63 μm ([O i]). Both beams are centered at the emission centroid derived by the PACS optimal extraction method (Sect. 3.1.1). The green cross shows the location of the X-ray point source (Sect. 3.3). The background image is HST/ACS F555W. The NW region coincides with an H i hole. The H i column density peak lies between NW and SE.
Current usage metrics show cumulative count of Article Views (full-text article views including HTML views, PDF and ePub downloads, according to the available data) and Abstracts Views on Vision4Press platform.
Data correspond to usage on the plateform after 2015. The current usage metrics is available 48-96 hours after online publication and is updated daily on week days.
Initial download of the metrics may take a while.