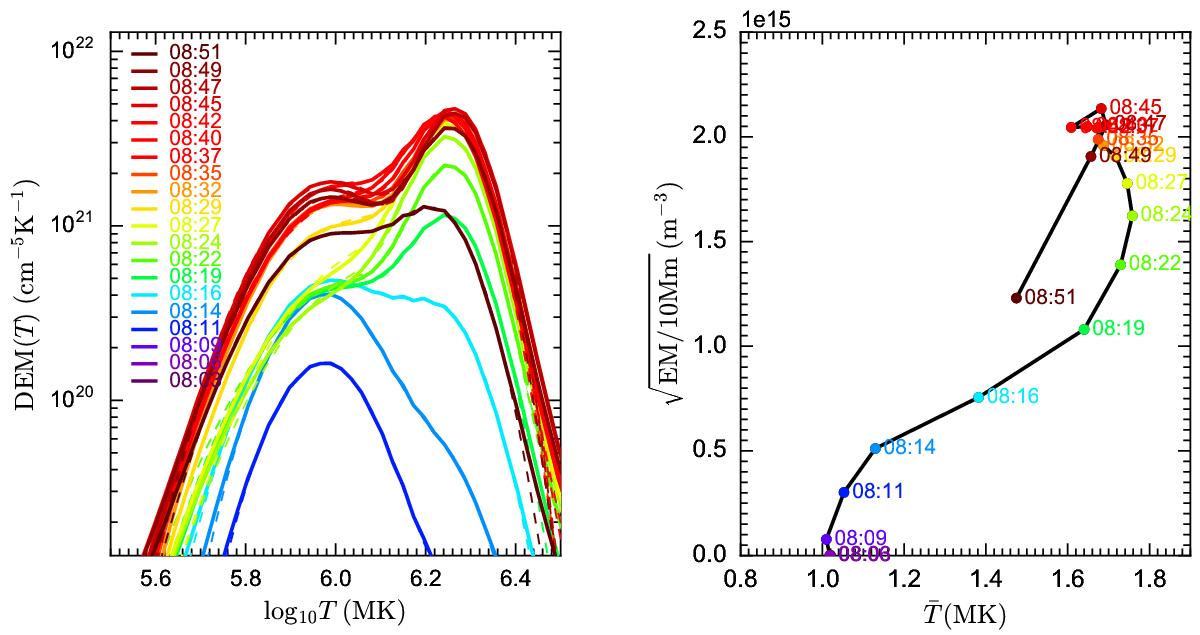
Fig. 8

Left: differential emission measure as a function of temperature determined from the AIA intensities along the track shown in Fig. 7. The initial intensity has been assumed to be the background intensity and has been subtracted. The dashed curve is a two-Gaussian fit. Right: electron number density, assuming a 10 Mm line-of-sight depth, as a function of EM-weighted average temperature over the interval 5.5 ≤ log T ≤ 6.5.
Current usage metrics show cumulative count of Article Views (full-text article views including HTML views, PDF and ePub downloads, according to the available data) and Abstracts Views on Vision4Press platform.
Data correspond to usage on the plateform after 2015. The current usage metrics is available 48-96 hours after online publication and is updated daily on week days.
Initial download of the metrics may take a while.


