Fig. 7
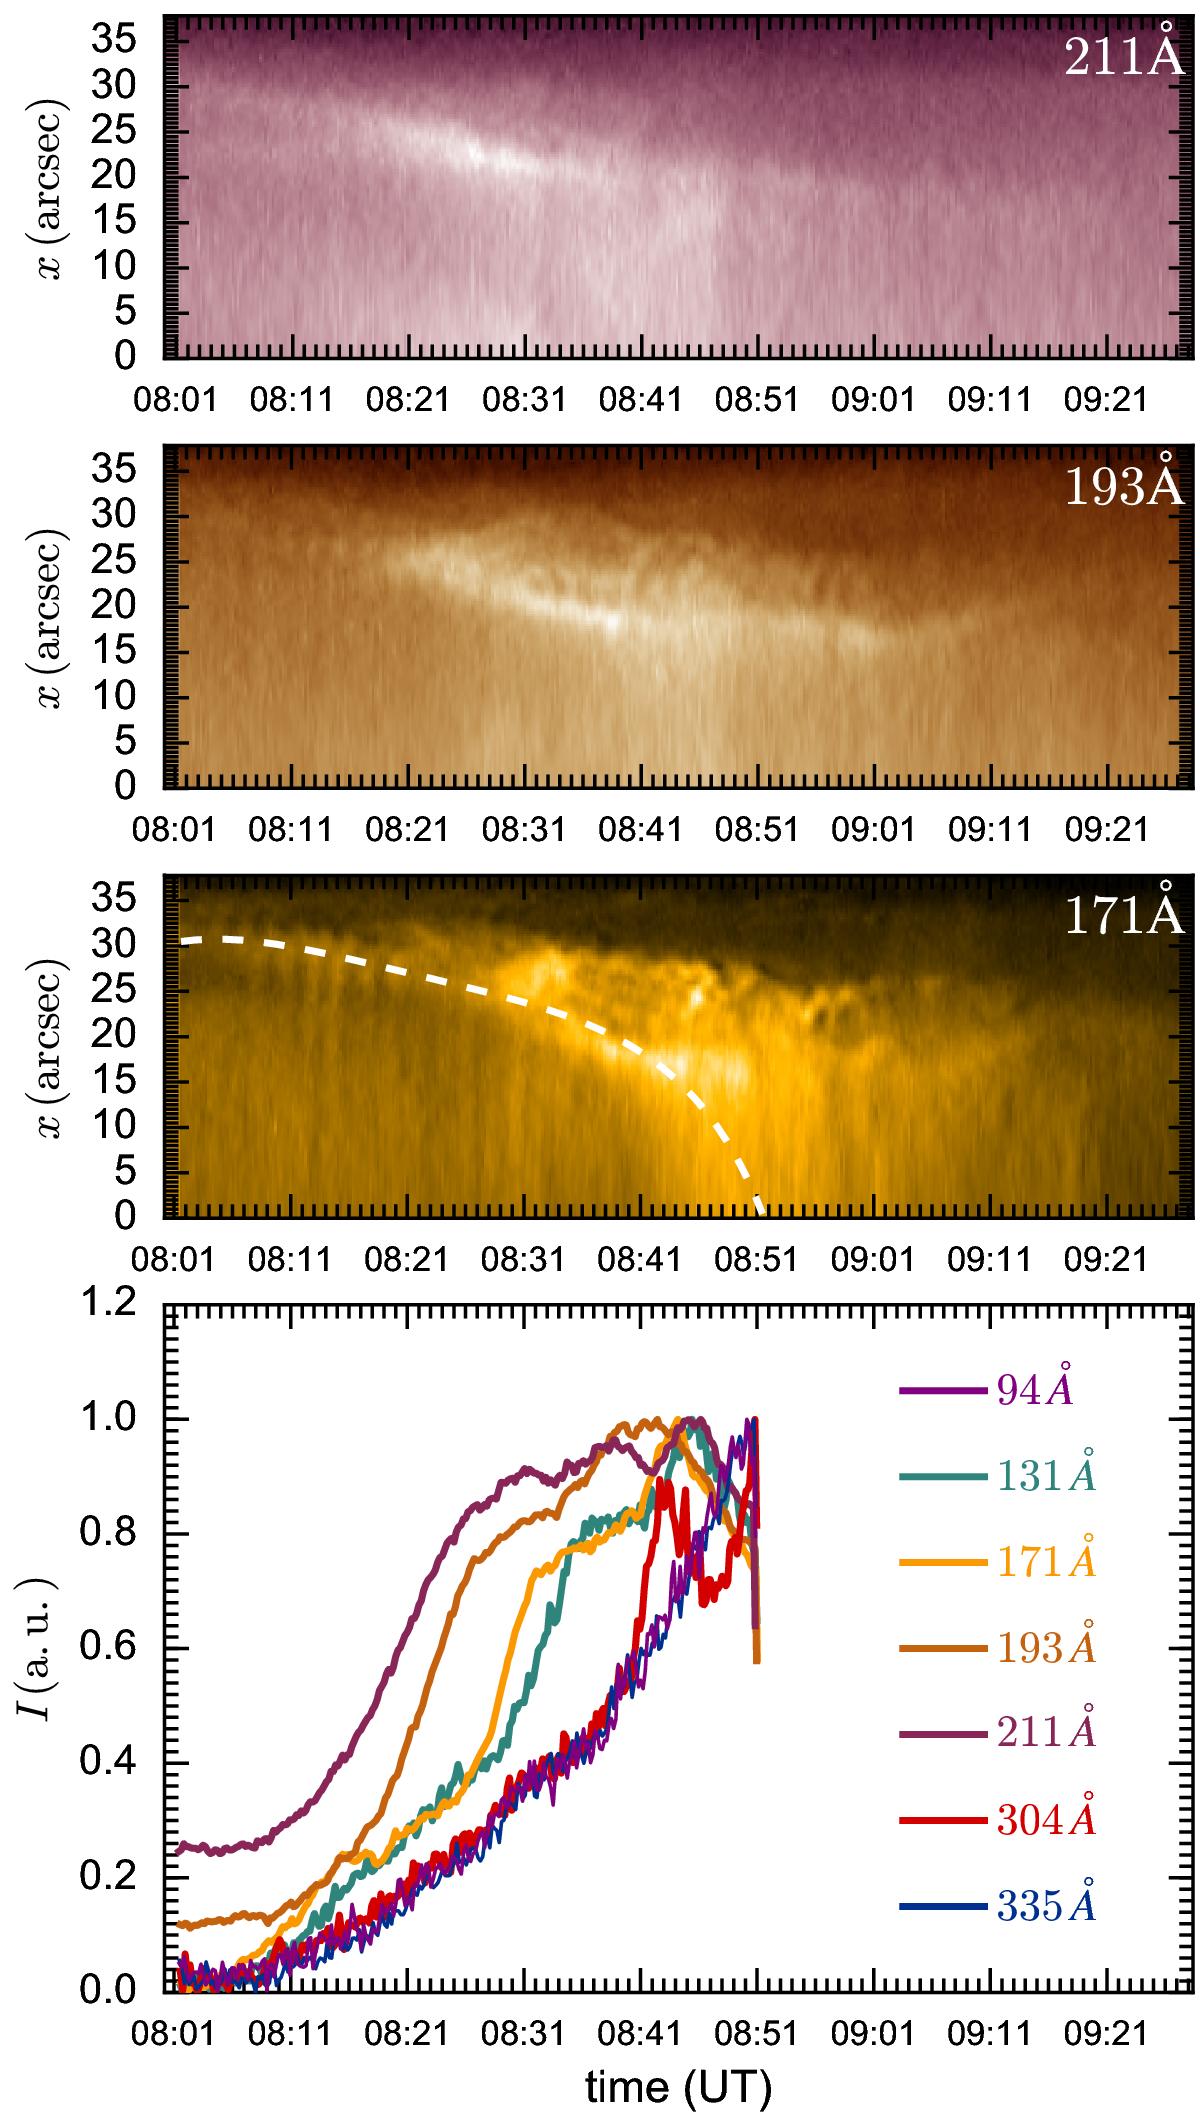
Time-distance plots of the transverse cuts in the SDO/AIA 211 Å, 193 Å, and 171 Å bandpasses, respectively. The top of the loop as seen in IRIS is at x = 15−20 arcsec where the intensity enhancement is visible in 171 Å. Bottom: intensity averaged across the data cut for each AIA bandpass, interpolated along the track highlighted in the 171 Å bandpass, as a function of time, normalised with respect to their peak value.
Current usage metrics show cumulative count of Article Views (full-text article views including HTML views, PDF and ePub downloads, according to the available data) and Abstracts Views on Vision4Press platform.
Data correspond to usage on the plateform after 2015. The current usage metrics is available 48-96 hours after online publication and is updated daily on week days.
Initial download of the metrics may take a while.