Fig. 6
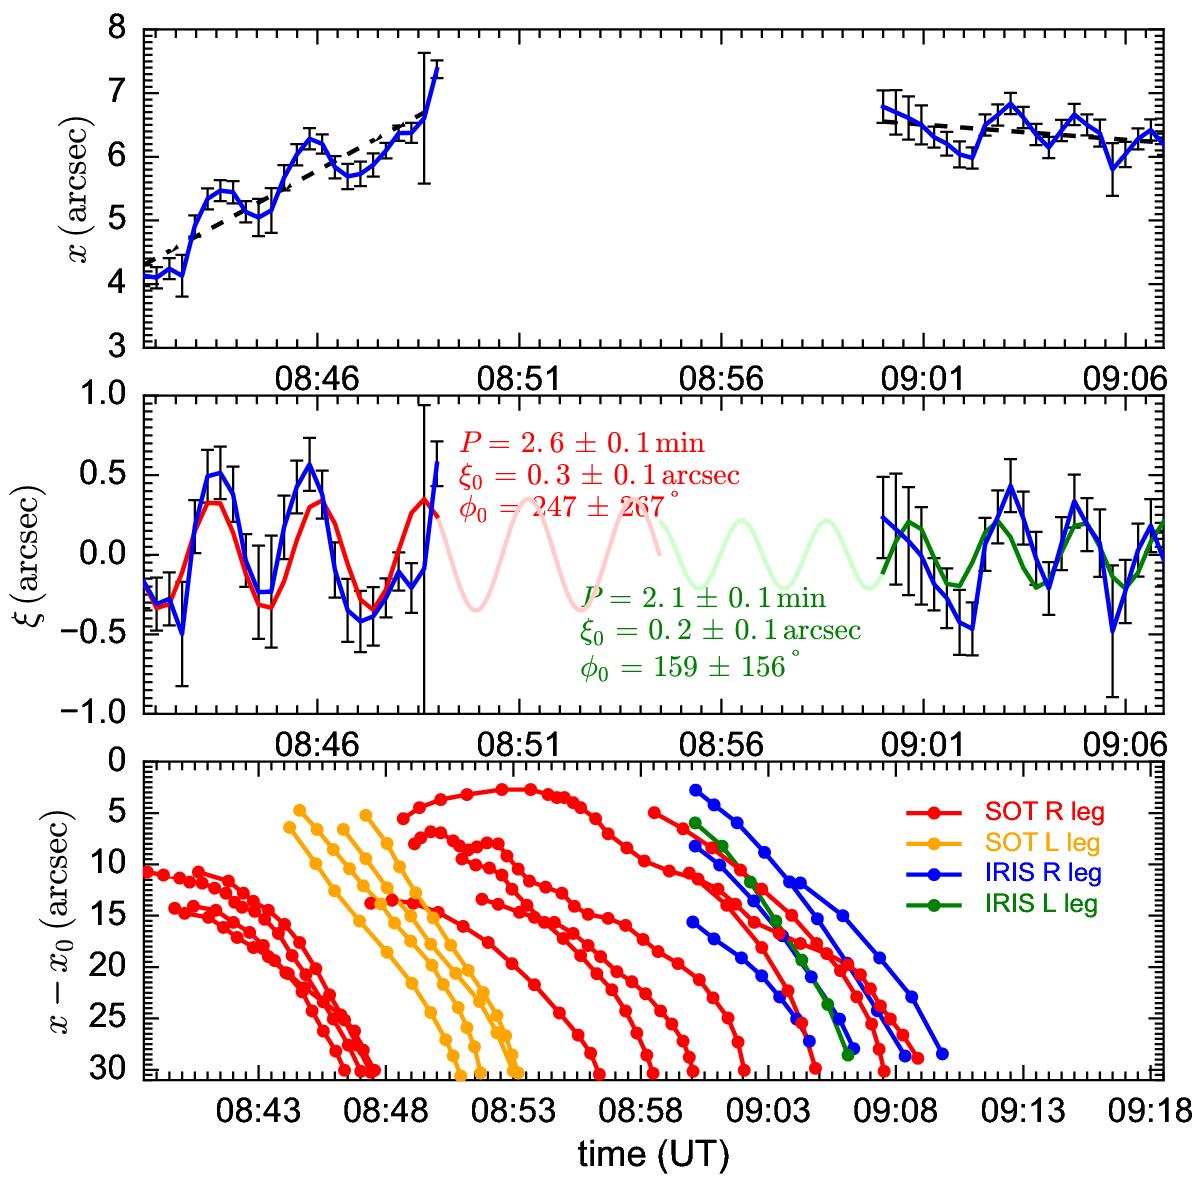
Top: loop position obtained from IRIS as a function of time. The error bars correspond to the half-width of a Gaussian profile fitted to the loop cross-section at each time. The dashed lines are linear fits to each time series. Middle: loop displacement as a function of time obtained by subtracting the linear profile from the loop position time series. The red and green curves are fitted sinusoidal curves with the corresponding parameters listed. Bottom: position of individual rain blobs as distance relative to the approximate loop top x0, as a function of time.
Current usage metrics show cumulative count of Article Views (full-text article views including HTML views, PDF and ePub downloads, according to the available data) and Abstracts Views on Vision4Press platform.
Data correspond to usage on the plateform after 2015. The current usage metrics is available 48-96 hours after online publication and is updated daily on week days.
Initial download of the metrics may take a while.