Fig. 5
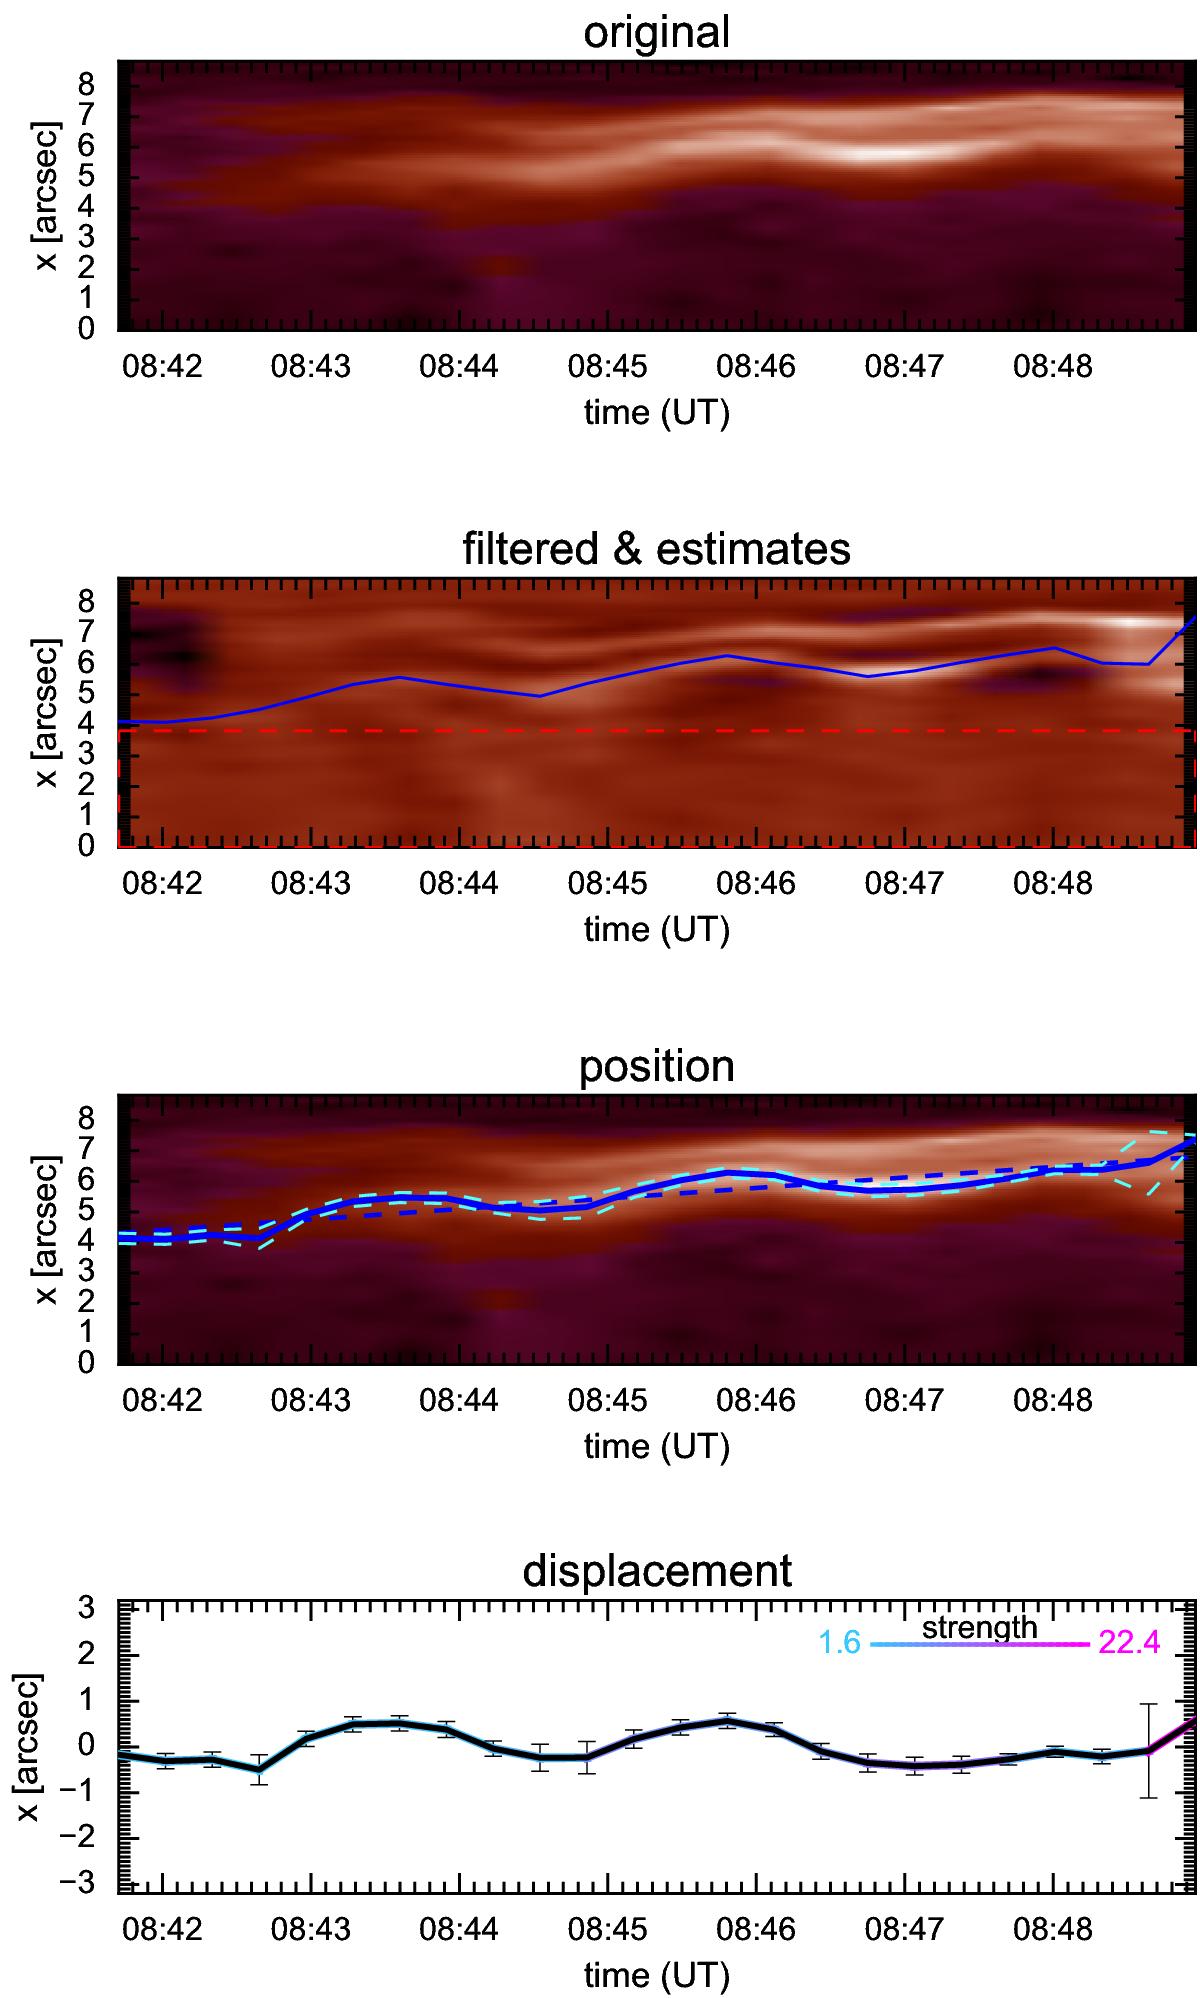
Procedure of measuring the transverse loop displacement as a function of time, for the first IRIS time period. Top: the original time-distance plot. Second: the wavelet-filtered plot with the estimated loop position superimposed. The section above the red dashed line has been used for measuring the loop position. Third: the measured loop displacement based on Gaussian fitting of the loop cross-section at each time. The light dashed lines are error estimates based on the half-width of the Gaussian profile. Bottom: the loop displacement as a function of time, achieved by subtracting a linear fit from the position. Colour represents the strength of the fit based on ridge strength.
Current usage metrics show cumulative count of Article Views (full-text article views including HTML views, PDF and ePub downloads, according to the available data) and Abstracts Views on Vision4Press platform.
Data correspond to usage on the plateform after 2015. The current usage metrics is available 48-96 hours after online publication and is updated daily on week days.
Initial download of the metrics may take a while.