Fig. 4
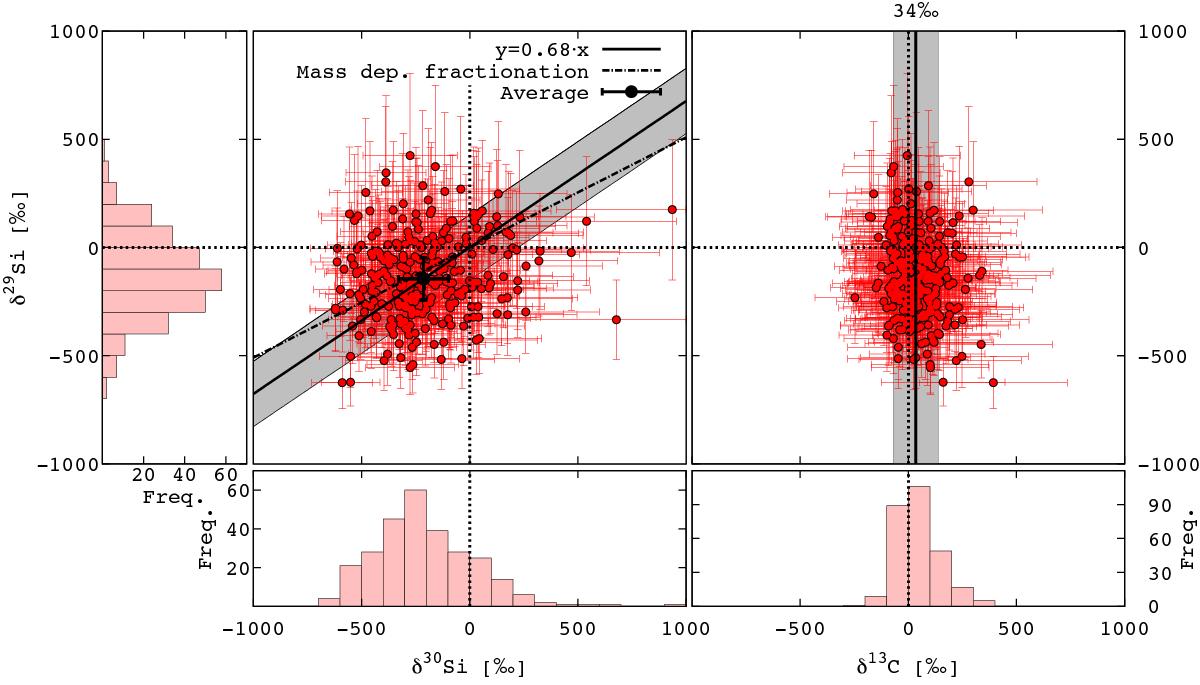
Measured isotopic ratios of Si plotted in δ-notation depicting deviations in permil (‰). Left: individual δ29Si vs. δ30Si ratios (red points) and average (black point). Also shown is the expected line from mass dependent fractionation (black dash-dotted line) and a line through the origin and average (black solid line, slope ~0.68) with error (gray area, see text). Right: data points showing individual δ29Si vs. δ13C in carbon monoxide and the black solid line the average δ13C = 34‰ with error (gray area, see text). The black dashed lines indicate the corresponding reference values in both plates from McSween & Huss (2010). Below and on the left side are the histograms of the individual measurements.
Current usage metrics show cumulative count of Article Views (full-text article views including HTML views, PDF and ePub downloads, according to the available data) and Abstracts Views on Vision4Press platform.
Data correspond to usage on the plateform after 2015. The current usage metrics is available 48-96 hours after online publication and is updated daily on week days.
Initial download of the metrics may take a while.