Fig. 7
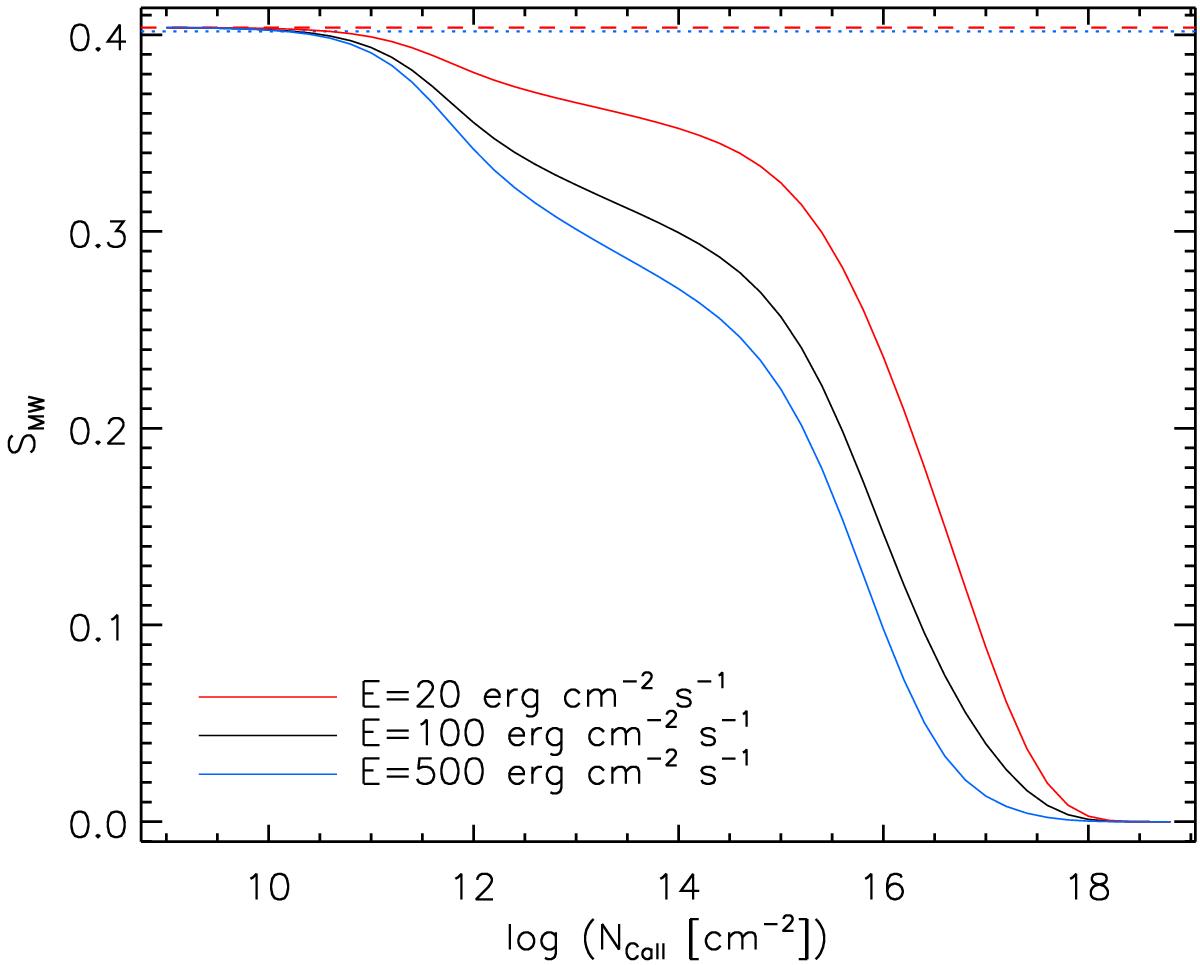
Variation of SMW as a function of log NCaII. Each line has been obtained considering different values of the emission E, as indicated in the legend. The dashed line shows the value of SE = 100, while the dotted line indicates typical photon noise uncertainties. For comparison purposes, the blue and red lines have been rescaled in order to match the black line at log NCaII = 0.
Current usage metrics show cumulative count of Article Views (full-text article views including HTML views, PDF and ePub downloads, according to the available data) and Abstracts Views on Vision4Press platform.
Data correspond to usage on the plateform after 2015. The current usage metrics is available 48-96 hours after online publication and is updated daily on week days.
Initial download of the metrics may take a while.