Fig. 6
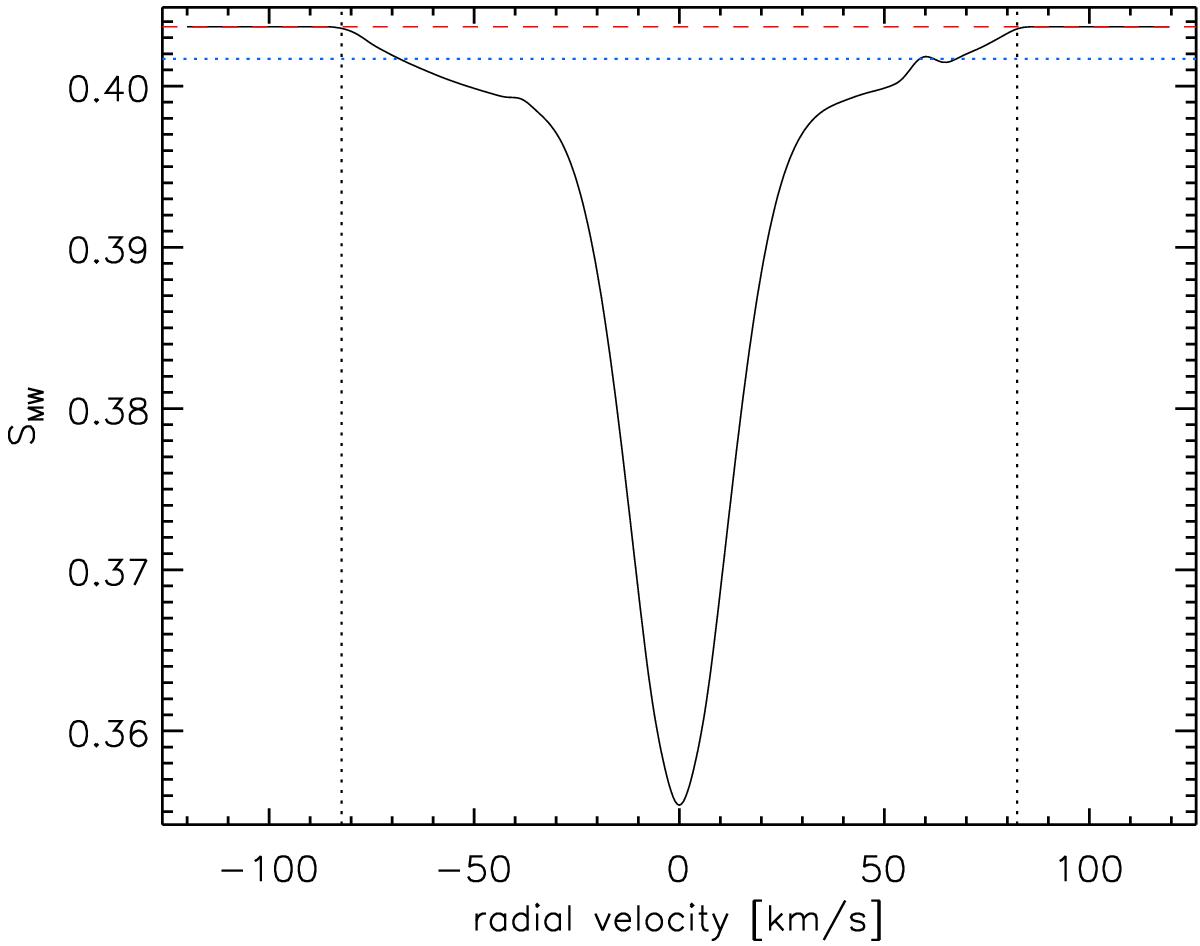
Variation of SMW as a function of radial velocity of the ISM absorption line. The dashed red line shows the SE = 100 value and the horizontal dotted blue line indicates the typical photon noise uncertainty, while the vertical dotted black lines represent the boundaries of the H and K passbands used to calculate the S value, converted to velocity space.
Current usage metrics show cumulative count of Article Views (full-text article views including HTML views, PDF and ePub downloads, according to the available data) and Abstracts Views on Vision4Press platform.
Data correspond to usage on the plateform after 2015. The current usage metrics is available 48-96 hours after online publication and is updated daily on week days.
Initial download of the metrics may take a while.