Fig. A.1
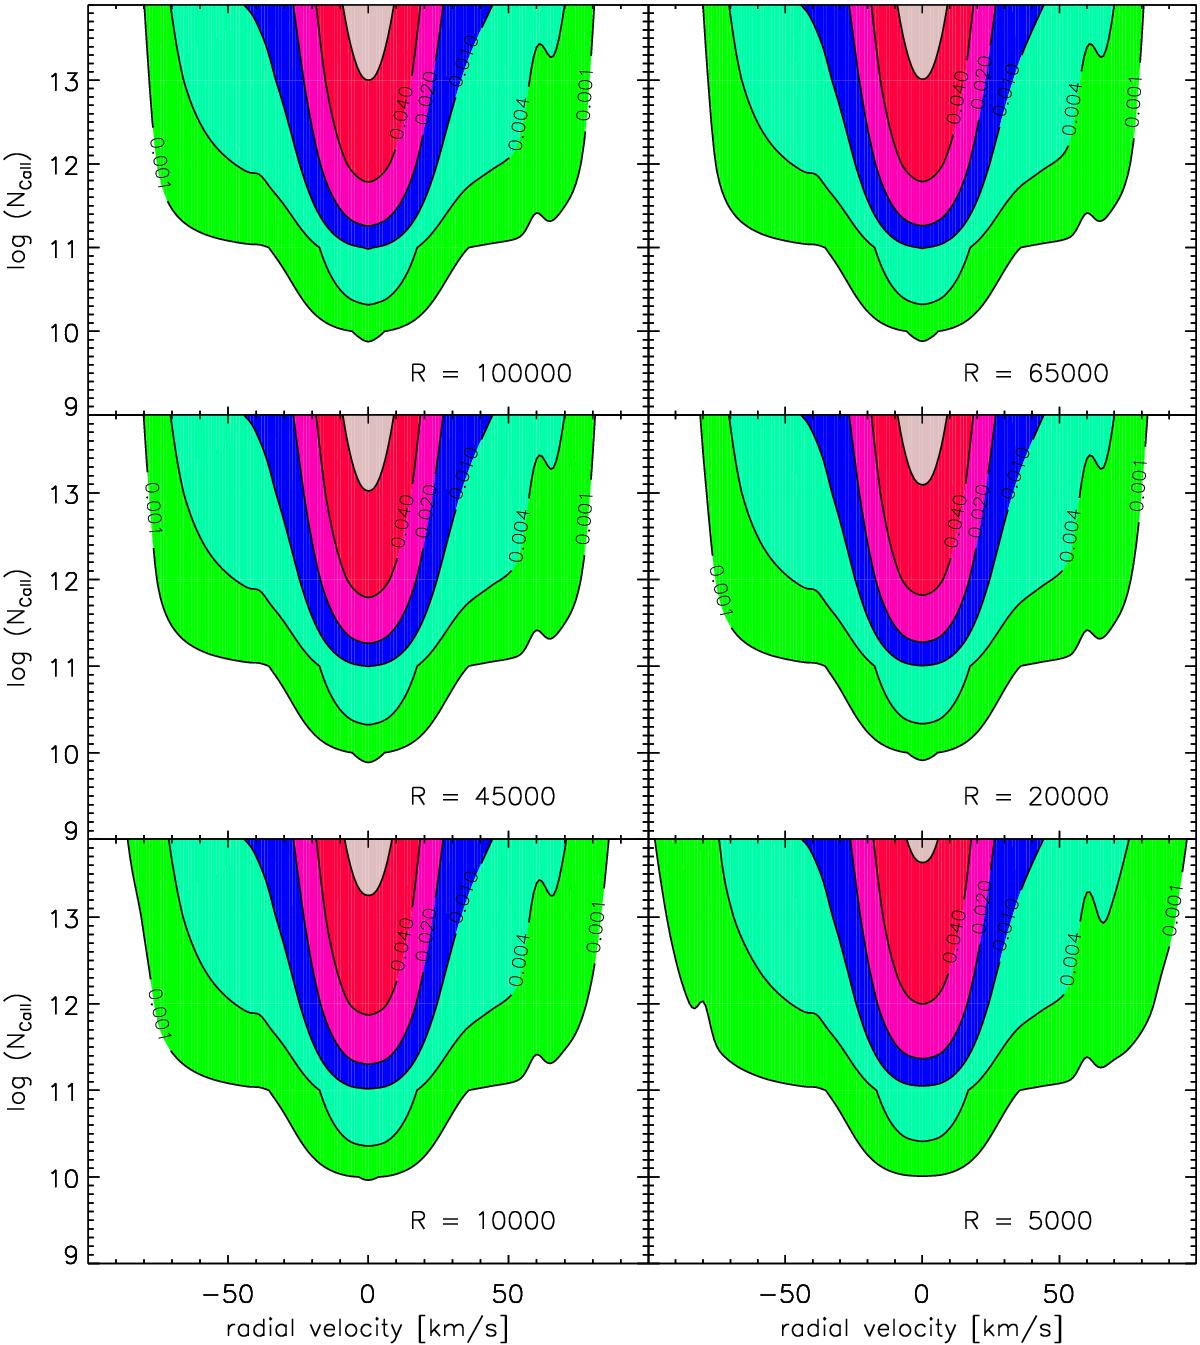
Difference between SE = 100 and the S values obtained by varying the spectral resolution and the ISM parameters (RV and log NCaII), keeping E fixed at 100 erg cm-2 s-1. The values along the lines of each contour (0.001, 0.004, 0.01, 0.02, 0.04, 0.08) quantify the SE = 100−S difference. The adopted spectral resolution is written in the bottom-right corner of each panel.
Current usage metrics show cumulative count of Article Views (full-text article views including HTML views, PDF and ePub downloads, according to the available data) and Abstracts Views on Vision4Press platform.
Data correspond to usage on the plateform after 2015. The current usage metrics is available 48-96 hours after online publication and is updated daily on week days.
Initial download of the metrics may take a while.