Fig. 14
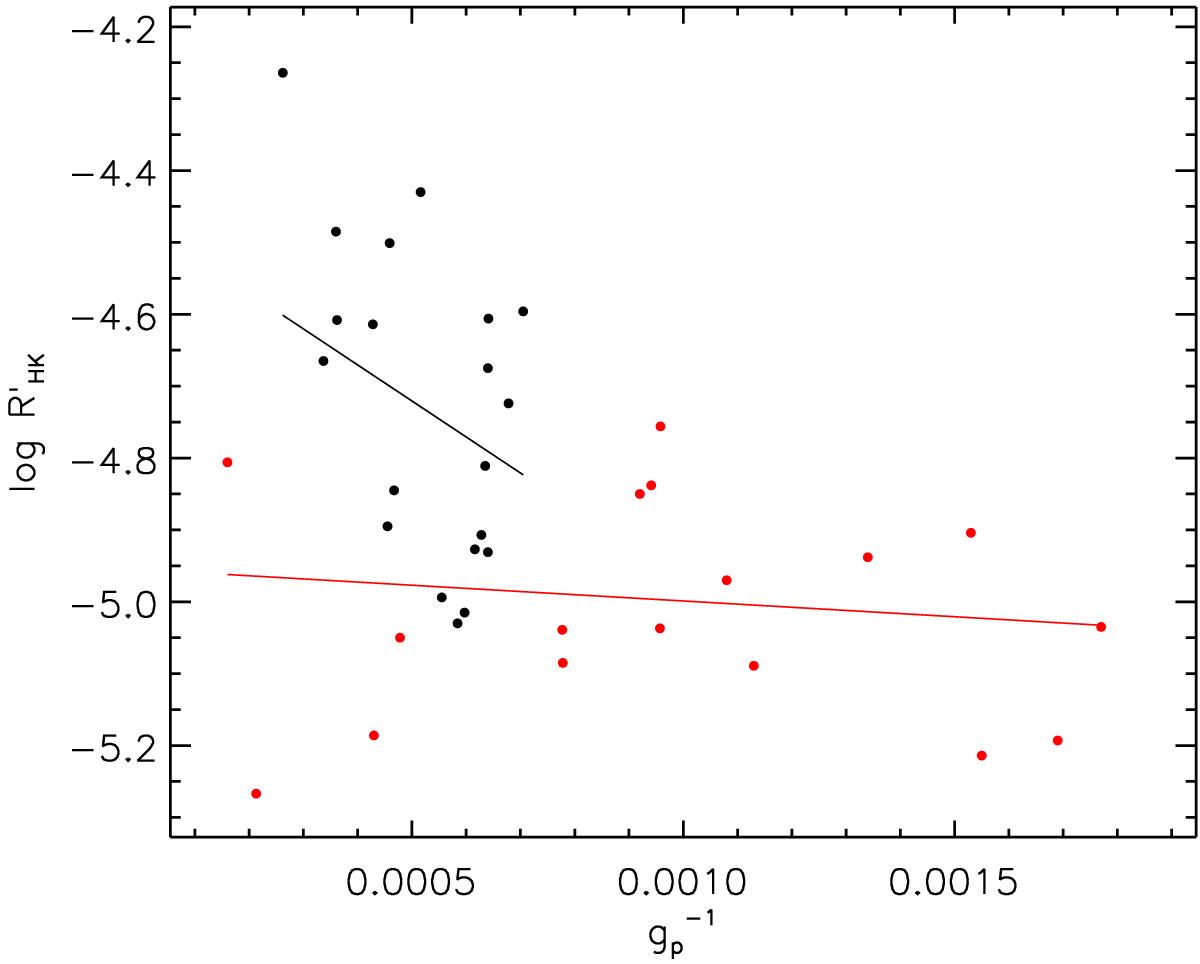
Chromospheric emission index ![]() versus the inverse of the planet gravity
versus the inverse of the planet gravity ![]() (in cm-2) with the two best-fit regression lines of the mixture model, described in Fossati et al. (2015a), in black and red. The data points assigned to each of the two regressions are plotted with the same colour coding of the corresponding regression line. The high- and low-activity components have respectively an intercept of −4.47 ± 0.14 and −4.95 ± 0.06 and a slope of −501 ± 247 and −44 ± 54 cm s-2.
(in cm-2) with the two best-fit regression lines of the mixture model, described in Fossati et al. (2015a), in black and red. The data points assigned to each of the two regressions are plotted with the same colour coding of the corresponding regression line. The high- and low-activity components have respectively an intercept of −4.47 ± 0.14 and −4.95 ± 0.06 and a slope of −501 ± 247 and −44 ± 54 cm s-2.
Current usage metrics show cumulative count of Article Views (full-text article views including HTML views, PDF and ePub downloads, according to the available data) and Abstracts Views on Vision4Press platform.
Data correspond to usage on the plateform after 2015. The current usage metrics is available 48-96 hours after online publication and is updated daily on week days.
Initial download of the metrics may take a while.