Fig. 12
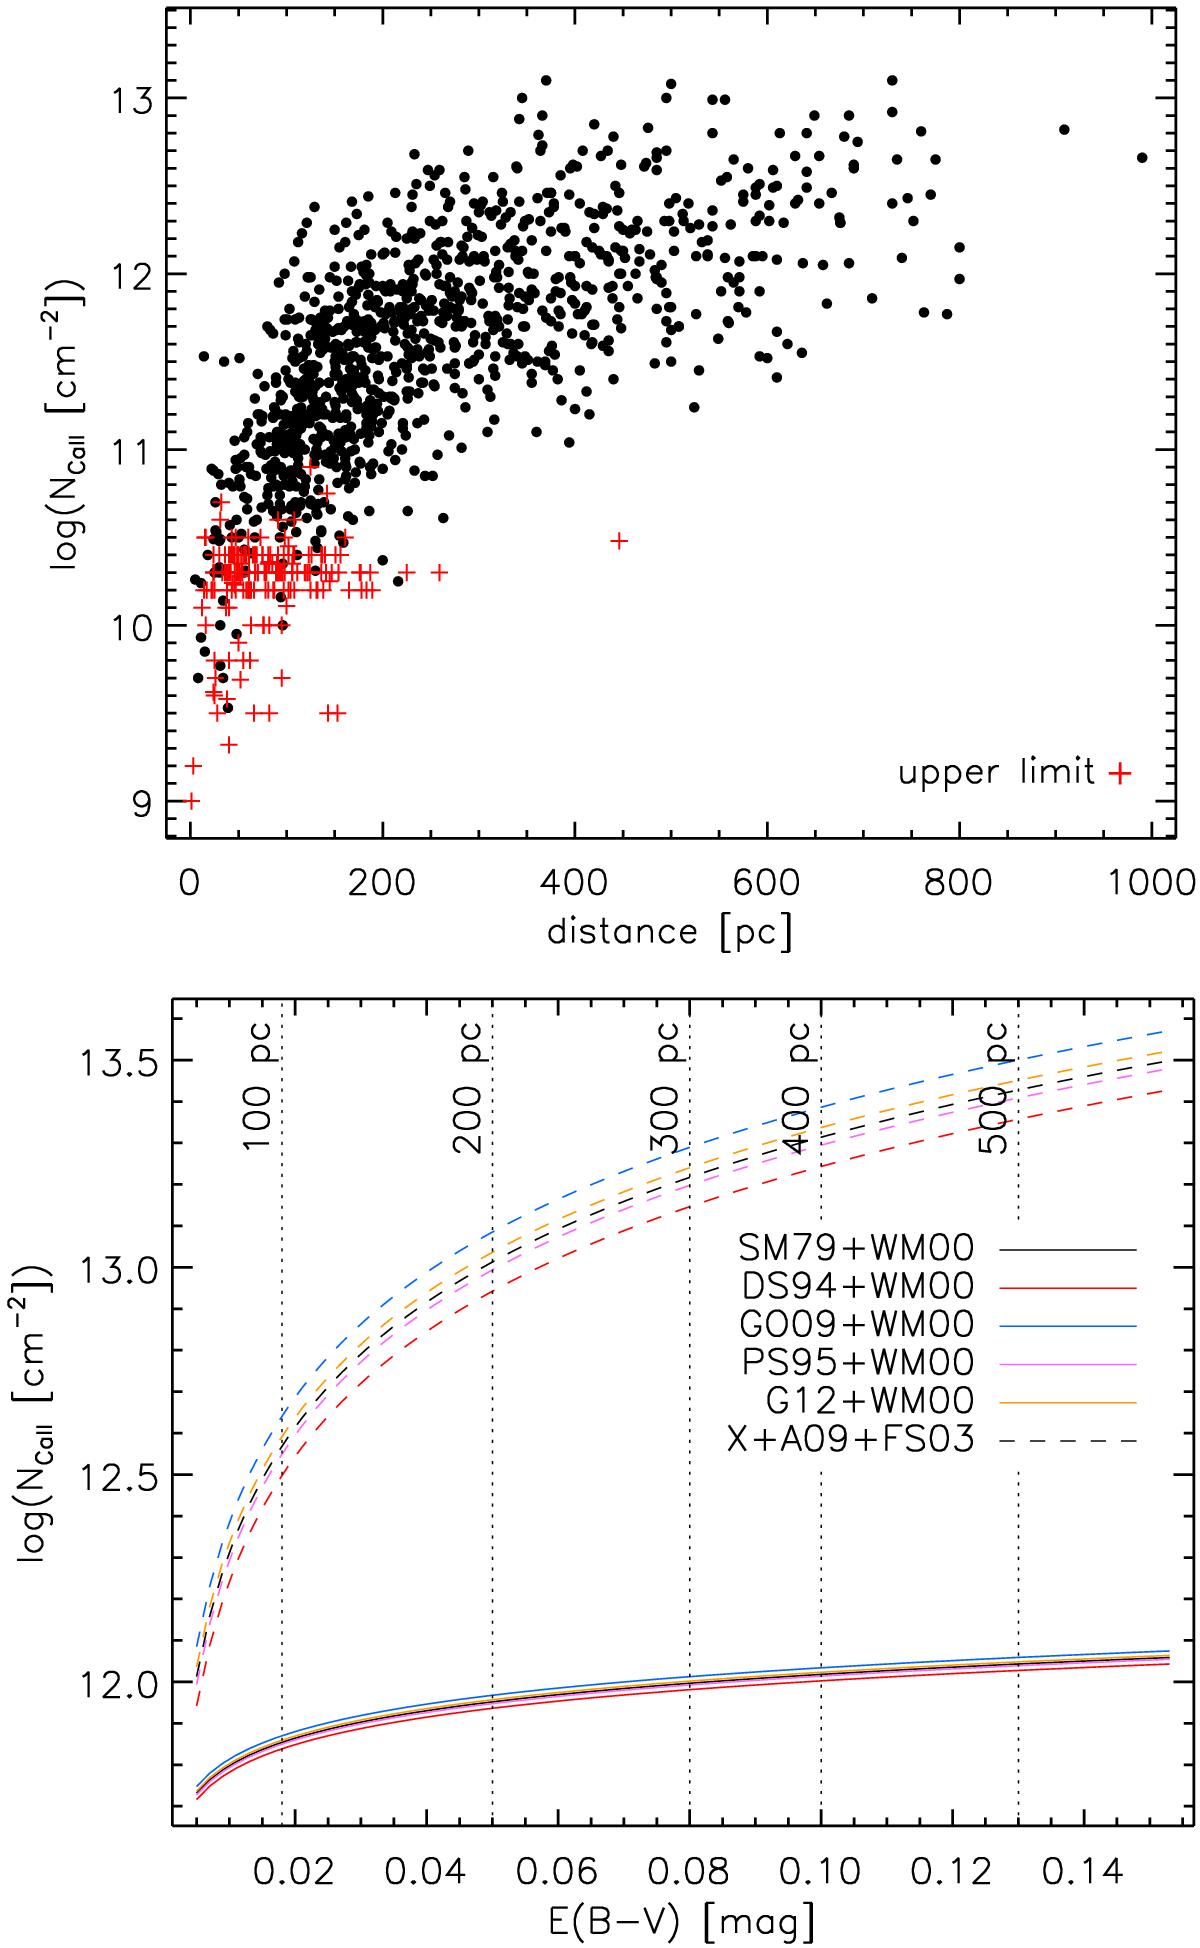
Top: measurements of log NCaII as a function of stellar distance collected by Welsh et al. (2010). Red pluses indicate upper limits. Bottom: log NCaII–E(B−V) correlations obtained by converting first E(B−V) into log NHI, using the relation given by Savage & Mathis (1979, SM79; black), Diplas & Savage (1994, DS94; red), Güver & Özel (2009, GO09; blue), Predehl & Schmitt (1995, PS95; purple), and Gudennavar et al. (2012, G12; yellow), and then log NHI into log NCaII, using either the log NHI–log NCaII relation given by Wakker & Mathis (2000, WM00; solid lines) or by using the Ca ii ISM ionisation fraction measured by Frisch & Slavin (2003, FS03) and assuming a solar Ca abundance (Asplund et al. 2009, A09; dashed lines). The “X” in the legend stands for any of SM79, DS94, GO09, PS95, or G12. The vertical dotted lines indicate the average distance at which a given E(B−V) value can be expected following the ISM extinction maps of Amôres & Lépine (2005). This figure justifies the upper boundary of log NCaII = 14 used for the analysis carried out in Sects. 4 and 5.
Current usage metrics show cumulative count of Article Views (full-text article views including HTML views, PDF and ePub downloads, according to the available data) and Abstracts Views on Vision4Press platform.
Data correspond to usage on the plateform after 2015. The current usage metrics is available 48-96 hours after online publication and is updated daily on week days.
Initial download of the metrics may take a while.