Fig. 11
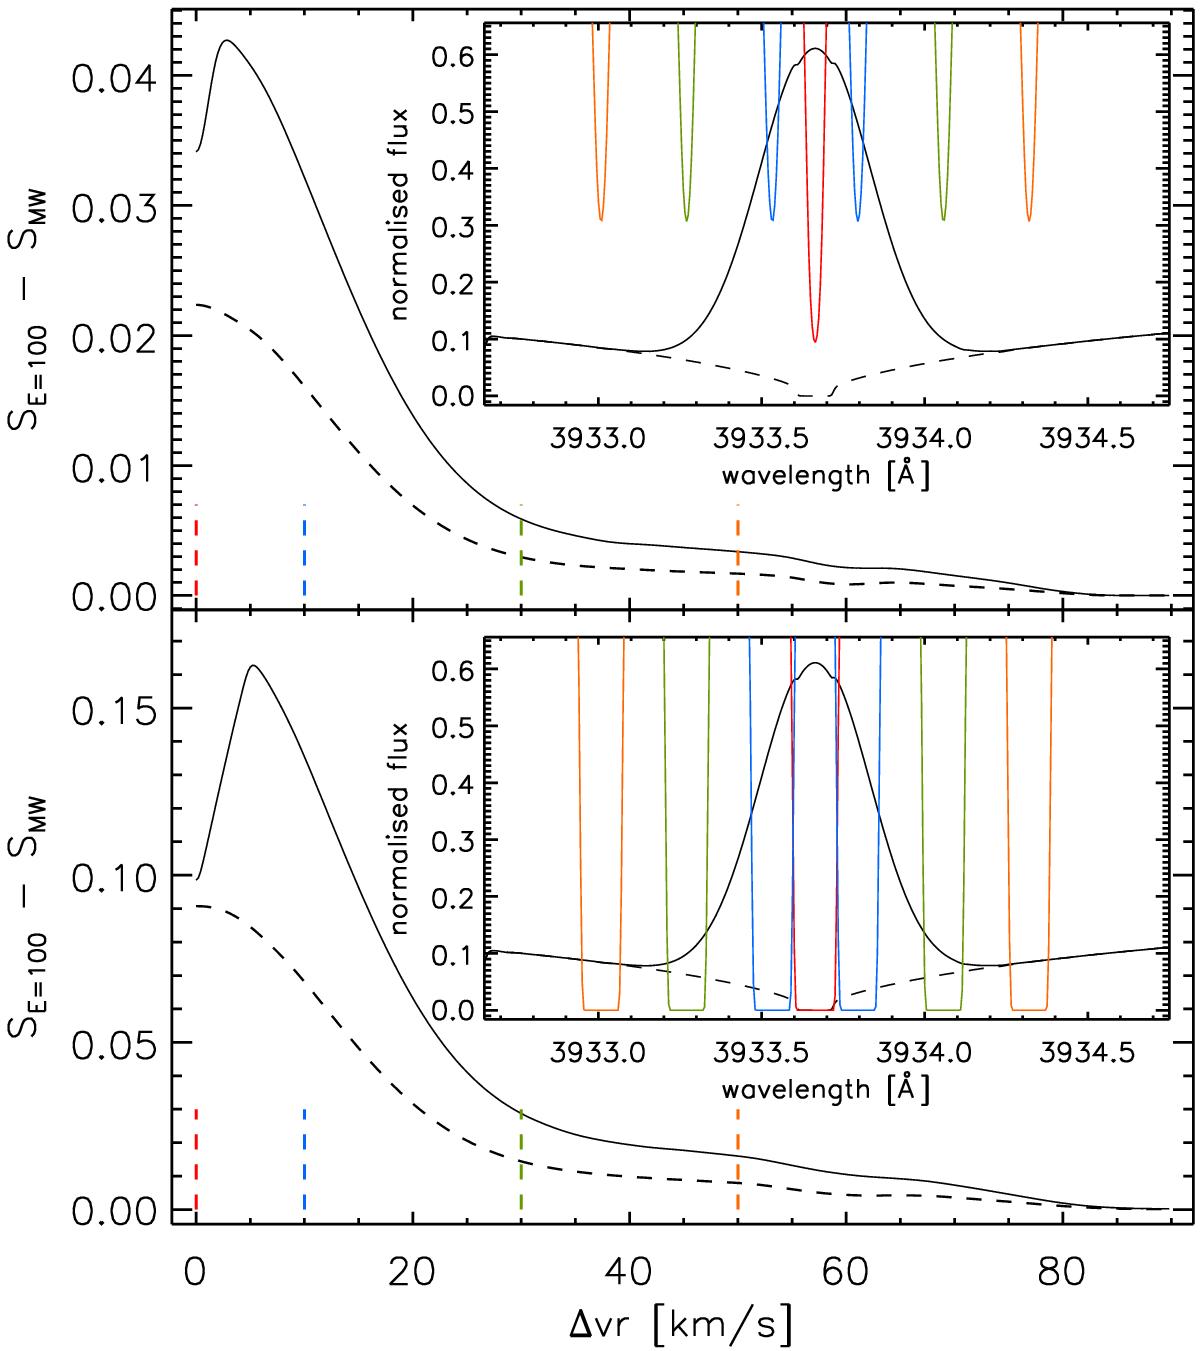
Top: difference between the reference S value SE = 100 calculated without ISM absorption, and SMW obtained considering two non-saturated (log NCaII = 11.5) ISM absorption components as a function of velocity separation (Δvr in km s-1) of each ISM feature from the line centre. With increasing Δvr, the two features move in opposite directions. The black dashed line shows the case of a single ISM absorption component moving redwards of the line centre. The short dashed vertical lines are colour-coded by the absorption features shown in the insert and indicate their position relative to the line centre. The insert shows the photospheric plus chromospheric flux (the photospheric spectrum is shown by a dashed line) in black and, as an example, absorption components lying at a velocity separation of 0.0 (red), ±10.0 (blue), ±30.0 (green), and ±50.0 (orange) km s-1 from the line centre. Bottom: as the top panel, but considering saturated (log NCaII = 14.0) ISM absorption lines.
Current usage metrics show cumulative count of Article Views (full-text article views including HTML views, PDF and ePub downloads, according to the available data) and Abstracts Views on Vision4Press platform.
Data correspond to usage on the plateform after 2015. The current usage metrics is available 48-96 hours after online publication and is updated daily on week days.
Initial download of the metrics may take a while.