| Issue |
A&A
Volume 601, May 2017
|
|
|---|---|---|
| Article Number | A136 | |
| Number of page(s) | 10 | |
| Section | Stellar atmospheres | |
| DOI | https://doi.org/10.1051/0004-6361/201630016 | |
| Published online | 23 May 2017 | |
First constraints on the magnetic field strength in extra-Galactic stars: FORS2 observations of Of?p stars in the Magellanic Clouds
1 Armagh Observatory and Planetarium, College Hill, Armagh, BT61 9DG, UK
e-mail: sba@arm.ac.uk
2 Institut d’Astrophysique et de Géophysique, Université de Liège, Quartier Agora (B5c), Allée du 6 Août 19c, 4000 Sart Tilman, Liège, Belgium
3 Department of Physics and Astronomy, University College London, Gower Street, London WC1E 6BT, UK
4 Las Campanas Observatory, Carnegie Observatories, Casilla 601, La Serena, Chile
5 Department of Physics, Royal Military College of Canada, PO Box 17000, Station Forces, ON, K7K 4B4, Canada
6 Space Telescope Science Institute, 3700 San Martin Drive, Baltimore, MD 21218, USA
7 European Southern Observatory, Karl-Schwarzschild-Str. 2, 85748 Garching bei München, Germany
8 Excellence Cluster Universe, 85748 Garching bei München, Germany
9 Departamento de Física, Universidad de La Serena, Av. Juan Cisternas 1200 Norte, La Serena, Chile
Received: 4 November 2016
Accepted: 23 February 2017
Massive O-type stars play a dominant role in our Universe, but many of their properties remain poorly constrained. In the last decade magnetic fields have been detected in all Galactic members of the distinctive Of?p class, opening the door to a better knowledge of all O-type stars. With the aim of extending the study of magnetic massive stars to nearby galaxies, to better understand the role of metallicity in the formation of their magnetic fields and magnetospheres, and to broaden our knowledge of the role of magnetic fields in massive star evolution, we carried out spectropolarimetry of five extra-Galactic Of?p stars, and of a couple of dozen neighbouring stars. We were able to measure magnetic fields with typical error bars from 0.2 to 1.0 kG, depending on the apparent magnitude and on weather conditions. No magnetic field was firmly detected in any of our measurements, but we were able to estimate upper limits on the field values of our target stars. One of our targets, 2dFS 936, exhibited an unexpected strengthening of emission lines. We confirm the unusual behaviour of BI 57, which exhibits a 787 d period with two photometric peaks and one spectroscopic maximum. The observed strengthening of the emission lines of 2dFS 936, and the lack of detection of a strong magnetic field in a star with such strong emission lines is at odd with expectations. Together with the unusual periodic behaviour of BI 57, it represents a challenge for the current models of Of?p stars. The limited precision that we obtained in our field measurements (in most cases as a consequence of poor weather) has led to field-strength upper limits that are substantially larger than those typically measured in Galactic magnetic O stars. Further higher precision observations and monitoring are clearly required.
Key words: Magellanic Clouds / stars: magnetic field / stars: massive / polarization
© ESO, 2017
1. Introduction
About 5–10% of Galactic OBA stars have detectable magnetic fields (e.g. Fossati et al. 2015, Wade et al. 2016). In these stars, the magnetic field is generally associated with spectral peculiarities that result from a variety of physical processes.
It has been known for a long time that most chemically peculiar A- and B-type stars in the Galaxy rotate much more slowly than their chemically normal counterparts in the same region of the HR diagram. A large subset of these stars – the Ap and Bp stars – have strong magnetic fields with a distinct characteristic: the observed field strength changes with time, with the same period as the stellar rotation (as deduced from photometric and spectroscopic measurements). The explanation is given in terms of a stable magnetic field, organised at a large scale, and not symmetric about the rotation axis (e.g. a dipolar field with its axis of symmetry inclined relative to the rotation axis), so that the observer sees a magnetic configuration that changes as the star rotates (Stibbs 1950). Since the field detection in the Galactic O stars θ1 Ori C and HD 191612 by Donati et al. (2002, 2006), it has become evident that magnetic fields are also found in massive O-type stars, and modelling such as that reported by Wade et al. (2011) strongly suggests that the magnetic fields of the slowly rotating O-type stars share the same topological characteristics of Ap and Bp stars, i.e. their magnetic field is dominated by a dipolar field tilted with respect to the rotation axis. In this context, the distinctive category of Of?p stars as defined by Walborn (1972; see also Walborn et al. 2011) is of particular importance, as all known Galactic Of?p stars have been found to be magnetic (e.g. Grunhut et al. 2017).
It is remarkable that stars ranging in mass from 1.5 to more than 50 M⊙ share such similar magnetic-field characteristics. Despite this fact, the origin of the magnetic fields in OBA-type stars is as yet uncertain. Whilst magnetic fields in late-type stars are thought to be generated through dynamo action, magnetic fields in OBA-type stars are likely of fossil origin (e.g. Donati & Landstreet 2009). Within the latter framework, different hypotheses have been put forward: conservation of the interstellar magnetic field trapped in the plasma during star formation and dynamos that acted during the earlier stages of pre-main sequence evolution (both scenarios are reviewed by Moss 2001), and, more recently, mass transfer and mergers in close binary systems, either when two proto-stellar objects merge while approaching the main sequence and at least one of them has already acquired a radiative envelope (Ferrario et al. 2009) or, at least for massive stars, during the main sequence (Langer 2012).
It is well understood that magnetic fields play a fundamental role in stellar evolution by transporting angular momentum and affecting stellar winds. Since these processes depend sensitively on the opacities contributed by metals, the conditions in low-metallicity dwarf galaxies might of course be altogether different from those in a high-metallicity spiral such as our own Milky Way, but these aspects remain as yet completely unexplored. Are these phenomena typical of our Galaxy only, or are they found elsewhere? Is the field strength that characterises the magnetic stars of our Galaxy also typical in nearby galaxies? To the best of our knowledge, the physical effects of metallicity on frequency and strength of stellar magnetic fields in early-type stars have not been explored theoretically. Nevertheless, investigating whether changes in metallicity have an impact on the formation and evolution of fossil fields would be very important. For instance, it has been recently proposed that during their life on the main sequence, massive stars develop an envelope inflation that is positively correlated with metallicity (as a result of a change of the characteristics of the Fe opacity bump, Gräfener et al. 2012; Sanyal et al. 2017). If confirmed, under the flux conservation one could speculate that fossil fields might be statistically stronger in massive stars with lower metallicity than in stars with higher metallicity. However, changes in metallicity may also alter the efficiency of interstellar medium flux advection (via changes to the electron density and ionisation balance), or modify the characteristics of convection and rotation driving the dynamos of pre-main sequence stars (via changes to envelope opacities and the efficiency of wind/disc braking), making any theoretical prediction or even speculation particularly complicated. In conclusion, seeking guidance from observations provides an important motivation to search for and study extra-Galactic magnetic stars.
We know that the Magellanic Clouds (MCs) host chemically peculiar stars (Maitzen et al. 2001; Paunzen et al. 2011), but they are too faint to be checked for magnetic fields with the currently available instrumentation. However, there are five known Of?p stars residing in the nearby MCs that are bright enough to be within reach of today’s instruments (Nazé et al. 2015; Walborn et al. 2015). The detection of their magnetic fields through spectropolarimetric techniques would be tremendously exciting, as these objects would be the first extra-Galactic stellar magnetic fields to be directly discovered. Moreover, these objects are expected to be different from their Galactic counterparts, as their metal content (Z) is lower, and mass-loss rates are thought to be lower at lower Z (Vink et al. 2001; Mokiem et al. 2007). One hypothesis is that magnetic fields of massive stars in the MCs are comparable to the Galactic ones because the variations in the observed spectroscopic and photometric features are comparable/are also comparable. On the other hand, given that the Galactic Of?p stars are thought to have a dynamical magnetosphere whose structure depends on the capability of the magnetic field to channel and confine the outflowing stellar wind, the similarities and differences in Galactic and Magellanic Cloud Of?p stars would provide important constraints on the interplay between stellar winds and magnetic fields in low-metallicity stars, providing a previously unavailable chance to understand the role of magnetic fields in the earlier Universe.
In this paper we describe the results of a spectropolarimetric survey of all Of?p stars known in the Large and Small Magellanic Clouds. Specifically, we searched for fields in three Of?p-type stars in the SMC (SMC 159-2, AzV 220 and 2dFS 936), and two Of?p-type stars in the LMC (BI 57 and LMC 164-2). Taking advantage of the multi-object capabilities of FORS2, we were also able to measure the magnetic field in several stars (typically 4–5) in the close neighbourhood of (≲ 3′) of each main target.
2. Observing strategy
The targets that we selected for our survey had been identified as Of?p stars because of their spectral peculiarities (see Walborn et al. 2015, for a historical summary). Recently, the analysis of photometric datasets enabled us to detect the brightness variations of our targets, deriving periods for four of them (Nazé et al. 2015). Nazé et al. (2015) correlated the photometric variability of SMC 159-2 to the spectral changes and Walborn et al. (2015) did the same for AzV 220, BI 57, and 2dFS 936, demonstrating that the Of?p stars in the Magellanic Clouds have similar behaviour to their Galactic counterparts.
2.1. FORS2 spectropolarimetry
To check whether these targets are magnetic, we obtained five half nights of telescope time with the FORS2 instrument (Appenzeller & Rupprecht 1992; Appenzeller et al. 1998) at the ESO VLT. FORS2 is a multipurpose instrument capable of imaging and low-resolution spectroscopy, and equipped with polarimetric optics (a retarder waveplate and a Wollaston prism). For the measurement of the magnetic field we used the technique described by Bagnulo et al. (2002) and Bagnulo et al. (2012). The five extra-Galactic Of?p stars were observed in multi-object mode, following the procedure already adopted by Bagnulo et al. (2006) for a survey of magnetic stars in open clusters, and by Nazé et al. (2012) for a magnetic survey of bright X-ray emitters.
The detection of a typical magnetic field in such faint and hot stars is just within the limits of the capabilities of the FORS2 instrument. Using the results of Bagnulo et al. (2015) we predicted that we could measure the longitudinal magnetic fields of our targets with a precision of ~ 250 G, which would allow us to reliably detect a field with longitudinal component of ~ 1 kG or higher. These predictions were based on extrapolation through the relationship  applied to FORS1 archive data (see Fig. 5 in Bagnulo et al. 2015).
The ability to detect a magnetic field crucially depends not only on the intrinsic strength of the magnetic fields of the targets, but also on the geometrical view of the stellar field at the time of the observations.
After the magnetic detections in Galactic O-type stars, it became clear that the longitudinal field, UV/visible line profile changes (in particular those of Hα), visible light curves of these stars (when available), and X-ray emission strength are correlated, i.e. the maximum brightness in the visible and X-rays and the maximum emission of the Hα equivalent widths (EW) correspond to the maximum of the absolute value of the longitudinal field. This is qualitatively explained as follows: the field confines the wind towards equatorial regions, so when these regions are seen face-on the associated emissions are at their maximum, while a minimum occurs when they are seen edge-on (Sundqvist et al. 2012). Generalising this behaviour, we requested new spectropolarimetric observations around the expected photometric maximum, to maximise the probability of field detection. We note that for the shorter period objects SMC 159-2 and LMC 164-2, the ephemeris uncertainties yield uncertainties on the dates and phases of the photometric maxima (at the time of our observations) of Δφ = 0.07 (Δt ~ 1 d) and Δφ = 0.05 (Δt ~ 0.4 d), respectively. However, a posteriori, the comparison of EW measurements from our new FORS2 data with those previously obtained by Nazé et al. (2015) and Walborn et al. (2015) allowed us to check the phases and assess whether our longitudinal field measurements were obtained reasonably close to the emission maximum (see Sect. 3.2), but we also note that our scheduling requirements could not always be met due to tight scheduling on the VLT.
Observations of reference magnetic stars are not included in the standard FORS2 calibration plan; nevertheless, they are needed to confirm that the position angle of the retarder waveplate is correctly reported by the instrument encoders. For this reason, we decided to use some of the twilight time to observe two well-known and bright magnetic Ap stars: HD 94660, which has an almost constant longitudinal magnetic field of −2 kG (e.g. Landstreet et al. 2014), and HD 188041, which has a well-known magnetic field that varies with a period of 223.78 d (Landstreet & Mathys 2000) and has been observed for more than 60 yr, starting from Babcock (1954).
FORS2 is normally offered both in service and visitor mode with an MIT CCD optimised for the red. In visitor mode it is possible to request the use of the EEV CCD previously used in the now decommissioned FORS1 instrument, which is optimised for the blue. Since we were interested in using the grism 1200B to cover the blue spectral region and since our hot (and low reddened) targets emit more flux in the blue than in the red, for our observing programme we requested the use of the EEV CCD. The actual spectral range depends on the position of the MOS slitlet in the field of view: with the slit in a central position, it was 3700–5120 Å.
2.2. UVES-FLAMES spectroscopy
Hβ and Hα observations of 2dFS 936 were obtained on 09 October 2015 at UT 06:58 (midpoint of 4.5 h exposure) and 10 October 2015 at UT 03:34 (midpoint of a 3 h exposure), on 08 November 2016 at UT 06:03 (midpoint of a 4.3 h exposure) and on 09 November 2016 at UT:01:23 (midpoint of a 2.1 h exposure) with the UVES spectrograph fed by FLAMES, using the setting 580 which covers the spectral ranges 4790–5770 Å and 5840–6815 Å with a spectral resolution of ~ 50 000.
3. Results
3.1. Longitudinal magnetic field measurements
Data were reduced as explained in Bagnulo et al. (2015). The mean longitudinal magnetic field ⟨ Bz ⟩ (i.e. the component of the magnetic field averaged over the visible stellar disc) was calculated by minimising the expression  (1)where, for each spectral point i, yi=PV(λi), xi=
 , and b is a constant introduced to account for possible spurious polarisation in the continuum. As a quality check, field measurements were also estimated from the null profiles (see Bagnulo et al. 2012, for an extensive discussion on the use of null profiles for quality check).
For the field measurement we considered three cases: in Eq. (1) we first used the spectral points including H Balmer lines only (adopting geff = 1 for the Landé factor; Casini & Landi Degl’Innocenti 1994), then we included He and metal lines only (setting geff = 1.25), and finally we included all spectral lines together (H, He, and metal). We also avoided emission lines to be sure to probe the stellar photosphere rather than the circumstellar environment. As the results of these three measurement procedures roughly agree, we report here only the last value, which also yields the smallest error bars. Figure 1 shows an example of field detection on one of the magnetic reference stars that we observed to check the correct alignment of the polarimetic optics. Figure 2 shows the same plots for the science target Of?p target LMC 164-2. Our full list of measurements is given in Table 1.
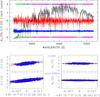 |
Fig. 1 FORS2 observations of the magnetic Ap star HD 188041. In the upper panel, the black solid line shows the Stokes I spectrum (uncorrected for the transmission function of the atmosphere + telescope and instrument optics); the red solid line shows the reduced Stokes V spectrum, PV = V/I (in % units), and the blue solid line is the null profile offset by − 1.25% for display purpose. The scattering of the null profile about zero is consistent (although sometimes slightly higher than) the 1σ photon-noise error bars, which are also shown centred around − 1.25% and appear as a light blue background to the null profile. Spectral regions highlighted by green bars (at the top and at the bottom of the panel) have been used to determine the ⟨ Bz ⟩ value from H Balmer lines, while the magenta bars highlight the spectral regions used to estimate the magnetic field from He and metal lines. The four bottom panels show the best-fit obtained by minimising the χ2 expression of Eq. (1) using the PV spectra (left panels) and the NV spectra (right panels) for H Balmer lines (upper panels) and metal lines (lower panels). |
3.2. Equivalent width measurements
FORS2 Stokes I spectra of all extra-Galactic Of?p stars are shown in Fig. 3. From these spectra we measured the EWs of the He II λ4686 and Hβ lines. For the star 2dFS 936 we also measured the EW of He II λ4686 and Hα from the UVES-FLAMES spectra (obtained in October 2015 and November 2016), and the EW of He II λ4686 and Hβ from the spectra obtained in May 2016 with the Boller & Chivens (B&C) spectrograph of the du Pont telescope at Las Campanas Observatory. All these new measurements are given in Table 2 and shown in Fig. 4, together with EW measurements obtained previously by Walborn et al. (2015; for AzV 220, 2dFS 936 and BI57), by Massey & Duffy (2001; for 2dFS 936), and by Massey et al. (2014; for SMC 159-2 and LMC 164-2). In the following we comment on individual stars.
3.2.1. AzV 220
Using the EW data published by Walborn et al. (2015), Nazé et al. (2015) could not find an unambiguous period from the photometric data of AV 220; however, a clear correlation between photometric and spectroscopic variations was found by Walborn et al. (2015). Our new EWs are intermediate between the minimum and maximum values, suggesting a small decline in recent times. Simultaneous OGLE photometry also indicates some decrease (M. Szymanski, priv. comm.), confirming the good correlation between photometry and spectroscopy. However, this suggests that our spectropolarimetry was not obtained close to the maximum of EW.
3.2.2. 2dFS 936
For this star we considered the original B&C spectra obtained in October 2000 by Massey & Duffy (2001; in their Table 2 the star was labelled “Anon 1”), the data published by Walborn et al. (2015), as well as the new data presented in Table 2, namely the measurements from our FORS2 data obtained in October 2015, from a B&C spectrum obtained in May 2016, and from UVES-FLAMES spectra obtained in October 2015 and in November 2016. Massey & Duffy (2001) reported only the EW of He II λ4686; from the same spectra we also measured the EW of Hβ (− 2.28 ± 0.05). Our new 2015 FORS2 data were obtained at a very favourable phase (φ = 0.4), close to that expected for the maximum emission (φ = 0.5). However, the measured EWs yield a surprise: the emissions are much stronger than have been seen to date. The UVES-FLAMES spectrum (see Fig. 5) and our low-resolution spectrum taken in May 2016 with the B&C confirms this emission increase; Fig. 6 shows the comparison between data obtained in October 2016 and May 2016 with a previous spectrum obtained with the B&C in May 2012 (Walborn et al. 2015). The spectrum obtained in October 2000 by Massey & Duffy also results in an EW value similar to those obtained in 2016. While this a priori enhances the chances of detection, it is at odds with the expectation that Of?p have a strictly repetitive behaviour. In addition, the recent photometry of 2dFS 936 does indicate a slight brightening, but this was not the case in October 2000 (M. Szymanski, priv. comm.).
Log of the FORS2 observations.
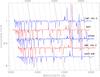 |
Fig. 3 Normalised FORS2 Stokes I spectra of the five extra-Galactic O?fp stars. For display purpose, spectra are offset both in x and y from each other. |
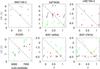 |
Fig. 4 Measurements of the EW of the emission components for our five target stars, plotted against Julian Date for AzV 220 and against rotational phase for the remaning targets (ephemerides from Nazé et al. 2015). For BI 57 we have considered both the case of a rotation period of 400 d and the case of a rotation period of 787 d. In all panels, triangles refer to He II λ4686, and circles to Hβ measurements. Red filled symbols refer to our new He II λ4686 and Hβ obtained with FORS2, FLAMES, and the B&C given in Table 2. Empty symbols refer to data obtained in previous works, as detailed in Sect. 3.2. |
3.2.3. BI 57
Nazé et al. (2015) suggested two photometric periods, 400 d and 787 d, with the latter providing a better correlation with spectroscopic variations (Walborn et al. 2015). The new EW measurements are clearly at odds with the 400 d period, but perfectly in phase with the 787 d period. However, BI 57 now appears to display two photometric maxima but only one peak for the emission EWs, hence does not belong to the “double wave” category of magnetic O-type stars, such as HD 57682 (Grunhut et al. 2012) and CPD− 28° 2561 (Wade et al. 2015), which have double maxima in both photometry and EWs. This unexpected behaviour had the consequence that our scheduling was not optimal: BI 57 was observed close to the EW minimum, hence probably when the longitudinal field is also expected to have a small absolute value, if the latter correlates with the emission line variations rather than the photometry.
3.2.4. SMC 159-2
For this star we used the data from Massey et al. (2014), (also used by Nazé et al. 2015), and our new FORS2 measurements of Table 2. We note that Massey et al. (2014) and Nazé et al. (2015) did not publish the EW measurements for Hβ that we use in Fig. 4, which we therefore report here: − 2.76 ± 0.10 Å in 2013 and − 3.00 ± 0.10 Å in 2014 (emission component only). For SMC 159-2, our spectropolarimetric data were taken at a rotational phase (φ = 0.49) very close to that of the maximum emission (0.50), and the measured EWs are indeed close to – and slightly higher than – those measured in 2014 at φ = 0.6. Our new spectropolarimetric data were indeed obtained at a very favourable time for the measurements of the magnetic field.
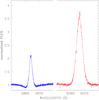 |
Fig. 5 Hβ and Hα of 2dFS 936 observed in October 2015 with UVES-FLAMES. |
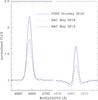 |
Fig. 6 He II λ4686 and Hβ of 2dFS 936 observed in May 2012 and in May 2016 with the B&C spectrograph, and in October 2015 with FORS2. |
Equivalent widths of the HeII 4686 and Hβ lines, and of the Hα line for 2dFS 936.
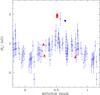 |
Fig. 7 Longitudinal field measurements of the magnetic star HD 188041. Blue empty circles are from previous works (Babcock 1954, 1958; Mathys 1994; Mathys & Hubrig 1997) and the blue solid square from this work. Measurements have been phased with the rotation period of 224.78 d (Landstreet & Mathys 2000). Red solid triangles refer to previous field measurement obtained with FORS1 and with different grisms (see Landstreet et al. 2014; Bagnulo et al. 2015, and references therein). |
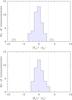 |
Fig. 8 Histogram of the distribution of the null field values (top panel) and of the field values (bottom panel) normalised to their photon-noise error bars. Note that the field detections of the Galactic calibrators HD 94660 and HD 188041 are outside of the plot limits. |
3.2.5. LMC 164-2
From the spectra obtained by Massey et al. (2014) at HJD = 2 456 640.755 (φ = 0.29) we measured the EW of the emission components of He II λ4686 (− 1.80 ± 0.10 Å) and Hβ (− 0.83 ± 0.03 Å). We also note that for He II λ4686, Massey et al. (2014) incorrectly reported the value of log (− EW) = − 0.2 instead of log (− EW) = + 0.2; therefore, in this paper we considered the value of EW − 100.2 = − 1.58. Our new data were obtained at phases further from the photometric maximum than the existing spectrum and, accordingly, the new EWs indicate smaller emission strengths than previously measured. We note, however, that the new data, even if not perfectly scheduled, were still taken far from the minimum emission.
4. Discussion
4.1. Quality check of field measurements: Galactic calibrators and statistical considerations
Our field measurements of HD 94660 (obtained on 2016 January 05 and on 2016 February 01) were found to be fully consistent with each other, and consistent with the expected value of ~− 2 kG (see Sect. 2.1). Figure 7 shows that our measurement of HD 188041 (obtained on 08 October 2016) is in line with previous FORS2 values, but higher than those obtained in the 1950s and in the 1990s by Babcock (1954, 1958), Mathys (1994), Mathys & Hubrig (1997), and phased with the rotation period given by Landstreet & Mathys (2000). A misalignment of the retarder waveplate would cause a decrease in the absolute value of the magnetic field, and could possibly change its sign, but could not increase the polarisation signal (see Eq. (55) of Bagnulo et al. 2009). Instead, it has been known for decades that the measured field strength does depend on instrument and instrument setting (e.g. Hensberge et al. 1979), and the case of FORS2 has been discussed in detail by Landstreet et al. (2014). Therefore, we conclude that all our measurements of HD 94660 and HD 188041 confirm that the position of the FORS2 retarder waveplate was correctly reported by the instrument encoders, and that it is unlikely that any field detection was missed because of instrumental problems.
Null field values were found to be reasonably close to zero within the error bars. The top panel of Fig. 8 shows the histogram of the distribution ⟨ Nz ⟩ /σz, which in the ideal case should be a Gaussian distribution centred about zero with σ = 1. Deviations from the ideal behaviour are not unexpected, as photon-noise is not the only source of uncertainty in our measurements. In particular, the remarkable outlier ⟨ Nz ⟩ /σz = − 8 comes from the field measurment of star HD 188041, and simply highlights the fact that when the S/N is pushed to extremely high values, other sources of noise become predominant, most likely tiny flexures in the instrument and/or seeing variations, as discussed thoroughly by Bagnulo et al. (2013). In addition, neighbouring stars show no detectable field – the two measurements in the 2.5 ≤ ⟨ Bz ⟩ /σz ≤ 3.5 interval corresponds to the nearly 3σ detection in SMC 159-2 and to the B0(V) star 2MASS J00500476-7321027.
The triple check (known magnetic stars, null diagnostics, neighbouring objects) indicate the absence of problems in our data.
4.2. Magnetic field measurements of Of?p stars
Because of the exceptional strength of its Hα emission (compared to Galactic Of?p stars), we expected SMC 159-2 to have an especially strong field, with a dipolar strength > 10 kG (Nazé et al. 2015). In fact, even such a strong field could escape detection if observed with FORS2 at unfavourable geometrical conditions, for instance when a dipole field is seen with the dipolar axis perpendicular to the line of sight. No matter what the dipolar field strength is, the average of the magnetic field component along the line of sight would be zero. However, as discussed in Sect. 2.1, in Galactic Of?p stars, the strength of the longitudinal field is correlated with the light curve and the emission lines, i.e. the longitudinal field is at a maximum when the light curve and emission-line intensities are highest, and as discussed in Sect. 3.2.4, the spectropolarimetric data of SMC 159-2 were taken close to that phase.
In the star SMC 159-2 we measured ⟨ Bz ⟩ = 2.8 ± 1 kG. This is nearly a 3σ detection of a 3 kG longitudinal field, which is roughly the value that we would expect from a 10 kG dipolar field observed pole-on. However, as extensively discussed by Bagnulo et al. (2012 and 2013), it is not possible to assign the classical statistical significance to the error bars formally derived from photon noise (which in this case would lead to the conclusion that a magnetic field has been detected with a very high confidence). Bagnulo et al. (2012) have argued that because of tiny instabilities in the instruments, as well as the uncertainty introduced by the choices made during data reduction, a field measurement with FORS1/2 can be considered a firm detection only when it corresponds to at least 5σ confidence (but we note that 5σ is a general guideline and not a number derived from rigorous theoretical considerations). We should note that we also detected a null field at the 2σ level in the same spectrum, which might further weaken the credibility of our ⟨ Bz ⟩ detection at 2.8σ level. Therefore, we conclude that our field detection is too marginal to be considered reliable. At the same time, we can assume that with a formal error bar of ~ 1 kG, we would have certainly detected a 5 kG longitudinal field, and we conclude that it is unlikely that SMC 159-2, at the time of our observation, exhibited a longitudinal field ≳ 5 kG. We conclude that our measurement of SMC 159-2 is not sufficiently precise to fully rule out a dipolar field of the strength predicted by Nazé et al. (2015), but most probably SMC 159-2 is not a star with magnetic properties similar to the Galactic Of?p star NGC 1624-2, which is reported to have a dipole field of nearly 20 kG. More observations are needed to better constrain the field of SMC 159-2.
We discovered that the star 2dFS 936 also had a strong emission in He II λ4686 and Hβ at the epoch of our observations. Although Hα was not as strong as measured previously for SMC 159-2 (− 12.12 Å against a maximum of − 19.2 Å measured on SMC 159-2 by Nazé et al. 2015), we still expect that 2dFS 936 would exhibit a strong and detectable field. However, for 2dFS 936 we measured ⟨ Bz ⟩ = − 1 ± 0.5 kG, which sets a lower limit to ~ 2.0 − 2.5 kG to the actual ⟨ Bz ⟩ value.
Vink et al. (2001) predicted Ṁv∞ ∝ Z0.85, where Ṁv∞ is the wind momentum and Z the stellar metallicity (see their Eq. (25)). Given the lower metal content of the SMC (~ 0.2 Z⊙), we would expect a wind momentum a factor of four smaller than in Galactic O stars (0.20.85 ~ 0.25). Therefore, in the SMC, the wind confinement parameter  (where B∗ is the field strength at the surface of the star with radius R∗) reaches the same value for half the field strength needed in our Galaxy. This might explain why in the Magellanic Clouds we can detect stars with strong emission lines and no strong magnetic fields. Nevertheless, our lack of field detection in 2dFS 936 somewhat weakens our hypothesis that the strength of the emission lines and that of the longitudinal field may both be explained in terms of the Oblique Rotator Model (ORM).
For the other three Of?p stars, no specific expectation (even qualitative) on the magnetic strength could be made. Our data indicate no detection for any of the stars: 0.5 ± 0.6 kG in AzV 220; − 0.36 ± 0.35 kG in BI 57; 0.20 ± 0.56 kG; and − 0.55 ± 0.90 kG in LMC 164-2. Upper limits of 5σ on | ⟨ Bz ⟩ | amount to 3, 1.7, and 3 kG for AzV 220, LMC 164-2, and BI 57, respectively. As seen in previous sections, data were not obtained at an optimal time for AzV 220 and LMC 164-2, and even far from it for BI 57, limiting our detection capability.
Wade (2015) summarised that the inferred surface dipole strengths of magnetic O stars (including Of?p stars) are typically in the range 1–3 kG (see Fig. 4 in Wade 2015). The smallest dipolar strength inferred in an Of?p star is of a few hundred G (an upper limit estimated for HD 37742 by Blazère et al., in prep.), followed by ≲ 1 kG in the case of HD 148937 (Wade et al. 2012b), to ~ 2.5kG in HD 191612 (discovered as an Of?p star by Walborn 1973), and in CPD − 28°2561. However, we note that HD 191612 and CPD − 28°2561 show at most a longitudinal field of | ⟨ Bz ⟩ | ~ 600 G (Wade et al. 2011, 2015). Stronger fields are relatively rare, the most notable exception being NGC 1624-2 with a dipolar field strength of ~ 20 kG (Wade et al. 2012a). Therefore, the main conclusion that can be drawn so far is that the magnetic fields of Of?p stars in the Magellanic Clouds are not much stronger than in our Galaxy.
5. Conclusions
We have analysed the five known Of?p stars in the Magellanic Clouds with spectropolarimetric techniques to search for evidence of their magnetic fields. Checks using standard stars, null profiles, and neighbouring stars (not expected to be magnetic) were performed, and validated the reliability of our results. No magnetic field was detected, though some of our detection limits were higher than expected due to bad weather and (perhaps) to the fact that the epoch of observations did not always correspond to the expected phase of field maximum. This led to poorer upper limits on any undetected magnetic field that might be present.
Our expectations was that SMC 159-2, which was observed during a period of strong emission, would exhibit a strong magnetic field, possibly as large as 10 kG. Our data rule out the presence of longitudinal fields stronger than 5 kG (which admittedly are very rare amongst Galactic magnetic stars). For 2dFS 936, which also showed very strong emission lines (which was unexpected), our data rule out a longitudinal field stronger than 2.0–2.5 kG at the epoch of our observations. The lack of a detection of a strong field in a star with such very strong emission lines is at odds with our expectations.
The (non-polarimetric) spectroscopic observations of SMC 159-2 and LMC 164-2 are fully consistent with the previously observed behaviour of these stars, and those of AzV 220 indicate a recent, small decline in the emission line strength. In the remaining two stars, our spectroscopic observations reveal two unexpected features. First, they bring additional evidence that the best period of BI 57 is likely 787 d, showing that this star presents two photometric peaks for one peak in emission line strength, a feature never observed in Galactic magnetic O-type stars. Second, they show a very strong and unexpected strengthening of the emission lines of 2dFS 936, suggesting that the behaviour of this star may not be as reproducible as for other Of?p stars.
Our findings suggest that the nature of Of?p stars may not be fully understood in terms of the Oblique Rotator Model, and call for a closer monitoring to better understand the interplay between magnetic fields and stellar winds, and to investigate the role of stellar metallicity in the magnetospheres of Of?p stars. More specifically, further photometric, spectroscopic, and spectropolarimetric monitoring in order to better sample the rotational cycle (especially of BI 57, SMC 159-2 and 2dFS 936) could set more stringent constraints on the modelling of the circumstellar environments of massive stars.
Acknowledgments
Based on observations made with ESO Telescopes at the La Silla Paranal Observatory under programme IDs 096.D-0856 (FORS specropolarimetric survey) and 096.D-0604(A) and 098.D-0876(A) (FLAMES spectra). We also acknowledge the use of archive data from programme ID 087.D-0870. Y.N. acknowledges support from the Fonds National de la Recherche Scientifique (Belgium) and the University of Liège, especially for travel to Chile, as well as general support from the PRODEX XMM and Integral contracts and the “Action de Recherche Concertée” (CFWB). G.A.W. acknowledges Discovery Grant support from he Natural Science and Engineering Research Council (NSERC) of Canada. We thank Michal Szymanski for making available some preliminary results from OGLE photometry, and Götz Gräfener for useful discussions.
References
- Appenzeller, I., & Rupprecht, G. 1992, The Messenger, 67, 18 [NASA ADS] [Google Scholar]
- Appenzeller, I., Fricke, K., Fürtig, W., et al. 1998, The Messenger, 94, 1 [NASA ADS] [Google Scholar]
- Babcock, H. W. 1954, ApJ, 120, 66 [NASA ADS] [CrossRef] [Google Scholar]
- Babcock, H. W. 1958, ApJS, 3, 141 [NASA ADS] [CrossRef] [Google Scholar]
- Bagnulo, S., Szeifert, T., Wade, G. A., Landstreet, J. D., & Mathys, G. 2002, A&A, 389, 191 [NASA ADS] [CrossRef] [EDP Sciences] [Google Scholar]
- Bagnulo, S., Landstreet, J. D., Mason, E., et al. 2006, A&A, 450, 777 [NASA ADS] [CrossRef] [EDP Sciences] [Google Scholar]
- Bagnulo, S., Landolfi, M., Landstreet, J. D., et al. 2009, PASP, 121, 993 [NASA ADS] [CrossRef] [Google Scholar]
- Bagnulo, S., Landstreet, J. D., Fossati, L., & Kochukhov, O. 2012, A&A, 538, A129 [NASA ADS] [CrossRef] [EDP Sciences] [Google Scholar]
- Bagnulo, S., Fossati, L., Kochukhov, O., & Landstreet, J. D. 2013, A&A, 559, A103 [NASA ADS] [CrossRef] [EDP Sciences] [Google Scholar]
- Bagnulo, S., Fossati, L., Landstreet, J. D., & Izzo, C. 2015, A&A, 583, A115 [NASA ADS] [CrossRef] [EDP Sciences] [Google Scholar]
- Casini, R., & Landi Degl’Innocenti, E. 1994, A&A, 291, 668 [NASA ADS] [Google Scholar]
- Donati, J.-F., & Landstreet, J. D. 2009, ARA&A, 47, 333 [NASA ADS] [CrossRef] [MathSciNet] [Google Scholar]
- Donati, J.-F., Babel, J., Harries, T. J., et al. 2002, MNRAS, 333, 55 [NASA ADS] [CrossRef] [MathSciNet] [Google Scholar]
- Donati, J.-F., Howarth, I. D., Bouret, J.-C., et al. 2006, MNRAS, 365, L6 [NASA ADS] [CrossRef] [Google Scholar]
- Ferrario, L., Pringle, J. E., Tout, C. A., & Wickramasinghe, D. T. 2009, MNRAS, 400, L71 [NASA ADS] [CrossRef] [Google Scholar]
- Fossati, L., Castro, N., Schöller, M., et al. 2015, A&A, 582, A45 [NASA ADS] [CrossRef] [EDP Sciences] [Google Scholar]
- Gräfener, G., Owocki, S. P., & Vink, J. S. 2012, A&A, 538, A40 [NASA ADS] [CrossRef] [EDP Sciences] [Google Scholar]
- Grunhut, J. H., Wade, G. A., Sundqvist, J. O., et al. 2012, MNRAS, 426, 2208 [NASA ADS] [CrossRef] [Google Scholar]
- Grunhut, J. H., Wade, G. A., Neiner, C., et al. 2017, MNRAS, 465, 2432 [NASA ADS] [CrossRef] [Google Scholar]
- Hensberge, H., van Rensbergen, W., Deridder, G., & Goossens, M. 1979, A&A, 75, 83 [NASA ADS] [Google Scholar]
- Landstreet, J. D., & Mathys, G. 2000, A&A, 359, 213 [NASA ADS] [Google Scholar]
- Landstreet, J. D., Bagnulo, S., & Fossati, L. 2014, A&A, 572, A113 [NASA ADS] [CrossRef] [EDP Sciences] [Google Scholar]
- Langer, N. 2012, ARA&A, 50, 107 [NASA ADS] [CrossRef] [Google Scholar]
- Maitzen, H. M., Paunzen, E., & Pintado, O. I. 2001, A&A, 371, L5 [NASA ADS] [CrossRef] [EDP Sciences] [Google Scholar]
- Massey, P., & Duffy, A. S. 2001, ApJ, 550, 713 [NASA ADS] [CrossRef] [Google Scholar]
- Massey, P., Neugent, K. F., Morrell, N., & Hillier, D. J. 2014, ApJ, 788, 83 [NASA ADS] [CrossRef] [Google Scholar]
- Mathys, G. 1994, A&AS, 108 [Google Scholar]
- Mathys, G., & Hubrig, S. 1997, A&AS, 124, 475 [NASA ADS] [CrossRef] [EDP Sciences] [Google Scholar]
- Mokiem, M. R., de Koter, A., Vink, J. S., et al. 2007, A&A, 473, 603 [NASA ADS] [CrossRef] [EDP Sciences] [Google Scholar]
- Moss, C. 2001, in Galaxy Disks and Disk Galaxies, eds. J. G. Funes, & E. M. Corsini, ASP Conf. Ser., 230, 487 [Google Scholar]
- Nazé, Y., Bagnulo, S., Petit, V., et al. 2012, MNRAS, 423, 3413 [NASA ADS] [CrossRef] [Google Scholar]
- Nazé, Y., Walborn, N. R., Morrell, N., Wade, G. A., & Szymański, M. K. 2015, A&A, 577, A107 [NASA ADS] [CrossRef] [EDP Sciences] [Google Scholar]
- Paunzen, E., Netopil, M., & Bord, D. J. 2011, MNRAS, 411, 260 [NASA ADS] [CrossRef] [Google Scholar]
- Sanyal, D., Langer, N., Szécsi, D., Yoon, S.-C., & Grassitelli, L. 2017, A&A, 597, A71 [NASA ADS] [CrossRef] [EDP Sciences] [Google Scholar]
- Stibbs, D. W. N. 1950, MNRAS, 110, 395 [NASA ADS] [CrossRef] [Google Scholar]
- Sundqvist, J. O., ud-Doula, A., Owocki, S. P., et al. 2012, MNRAS, 423, L21 [NASA ADS] [CrossRef] [Google Scholar]
- Vink, J. S., de Koter, A., & Lamers, H. J. G. L. M. 2001, A&A, 369, 574 [NASA ADS] [CrossRef] [EDP Sciences] [Google Scholar]
- Wade, G. A. 2015, in Physics and Evolution of Magnetic and Related Stars, eds. Y. Y. Balega, I. I. Romanyuk, & D. O. Kudryavtsev, ASP Conf. Ser., 494, 30 [Google Scholar]
- Wade, G. A., Howarth, I. D., Townsend, R. H. D., et al. 2011, MNRAS, 416, 3160 [NASA ADS] [CrossRef] [Google Scholar]
- Wade, G. A., Grunhut, J., Gräfener, G., et al. 2012a, MNRAS, 419, 2459 [NASA ADS] [CrossRef] [Google Scholar]
- Wade, G. A., Maíz Apellániz, J., Martins, F., et al. 2012b, MNRAS, 425, 1278 [NASA ADS] [CrossRef] [Google Scholar]
- Wade, G. A., Barbá, R. H., Grunhut, J., et al. 2015, MNRAS, 447, 2551 [NASA ADS] [CrossRef] [Google Scholar]
- Wade, G. A., Neiner, C., Alecian, E., et al. 2016, MNRAS, 456, 2 [NASA ADS] [CrossRef] [Google Scholar]
- Walborn, N. R. 1972, AJ, 77, 312 [NASA ADS] [CrossRef] [Google Scholar]
- Walborn, N. R. 1973, AJ, 78, 1067 [NASA ADS] [CrossRef] [Google Scholar]
- Walborn, N. R., Maíz Apellániz, J., Sota, A., et al. 2011, AJ, 142, 150 [NASA ADS] [CrossRef] [Google Scholar]
- Walborn, N. R., Morrell, N. I., Nazé, Y., et al. 2015, AJ, 150, 99 [NASA ADS] [CrossRef] [Google Scholar]
All Tables
Equivalent widths of the HeII 4686 and Hβ lines, and of the Hα line for 2dFS 936.
All Figures
|
Fig. 1 FORS2 observations of the magnetic Ap star HD 188041. In the upper panel, the black solid line shows the Stokes I spectrum (uncorrected for the transmission function of the atmosphere + telescope and instrument optics); the red solid line shows the reduced Stokes V spectrum, PV = V/I (in % units), and the blue solid line is the null profile offset by − 1.25% for display purpose. The scattering of the null profile about zero is consistent (although sometimes slightly higher than) the 1σ photon-noise error bars, which are also shown centred around − 1.25% and appear as a light blue background to the null profile. Spectral regions highlighted by green bars (at the top and at the bottom of the panel) have been used to determine the ⟨ Bz ⟩ value from H Balmer lines, while the magenta bars highlight the spectral regions used to estimate the magnetic field from He and metal lines. The four bottom panels show the best-fit obtained by minimising the χ2 expression of Eq. (1) using the PV spectra (left panels) and the NV spectra (right panels) for H Balmer lines (upper panels) and metal lines (lower panels). |
| In the text | |
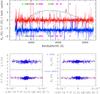 |
Fig. 2 Same as Fig. 1 for LMC 164-2 (observations obtained on 2016-01-05). |
| In the text | |
|
Fig. 3 Normalised FORS2 Stokes I spectra of the five extra-Galactic O?fp stars. For display purpose, spectra are offset both in x and y from each other. |
| In the text | |
|
Fig. 4 Measurements of the EW of the emission components for our five target stars, plotted against Julian Date for AzV 220 and against rotational phase for the remaning targets (ephemerides from Nazé et al. 2015). For BI 57 we have considered both the case of a rotation period of 400 d and the case of a rotation period of 787 d. In all panels, triangles refer to He II λ4686, and circles to Hβ measurements. Red filled symbols refer to our new He II λ4686 and Hβ obtained with FORS2, FLAMES, and the B&C given in Table 2. Empty symbols refer to data obtained in previous works, as detailed in Sect. 3.2. |
| In the text | |
|
Fig. 5 Hβ and Hα of 2dFS 936 observed in October 2015 with UVES-FLAMES. |
| In the text | |
|
Fig. 6 He II λ4686 and Hβ of 2dFS 936 observed in May 2012 and in May 2016 with the B&C spectrograph, and in October 2015 with FORS2. |
| In the text | |
|
Fig. 7 Longitudinal field measurements of the magnetic star HD 188041. Blue empty circles are from previous works (Babcock 1954, 1958; Mathys 1994; Mathys & Hubrig 1997) and the blue solid square from this work. Measurements have been phased with the rotation period of 224.78 d (Landstreet & Mathys 2000). Red solid triangles refer to previous field measurement obtained with FORS1 and with different grisms (see Landstreet et al. 2014; Bagnulo et al. 2015, and references therein). |
| In the text | |
|
Fig. 8 Histogram of the distribution of the null field values (top panel) and of the field values (bottom panel) normalised to their photon-noise error bars. Note that the field detections of the Galactic calibrators HD 94660 and HD 188041 are outside of the plot limits. |
| In the text | |
Current usage metrics show cumulative count of Article Views (full-text article views including HTML views, PDF and ePub downloads, according to the available data) and Abstracts Views on Vision4Press platform.
Data correspond to usage on the plateform after 2015. The current usage metrics is available 48-96 hours after online publication and is updated daily on week days.
Initial download of the metrics may take a while.