| Issue |
A&A
Volume 601, May 2017
|
|
|---|---|---|
| Article Number | A75 | |
| Number of page(s) | 8 | |
| Section | Stellar structure and evolution | |
| DOI | https://doi.org/10.1051/0004-6361/201630011 | |
| Published online | 04 May 2017 | |
Irradiated stars with convective envelopes
Astrophysics Group, Blackett Laboratory, Imperial College London, Prince Consort Road, London, SW7 2AZ, UK
e-mail: l.lucy@imperial.ac.uk
Received: 4 November 2016
Accepted: 26 March 2017
The observed radii of M dwarfs in eclipsing binaries exceed predicted radii by ~5%. To investigate this anomaly, the structure of low-mass stars irradiated by a close companion is considered. Irradiation modifies the surface boundary conditions and thereby also the adiabatic constants of their outer convection zones. This changes the models’ radii and luminosities. For short-period M dwarf binaries with components of similar mass, radius inflation due to their mutual irradiation is found to be ≲0.4%. This is an order of magnitude too small to explain the observed anomaly. Although stronger irradiation results in a monotonically increasing radius, a saturation effect limits the inflation to ≲5%.
Key words: stars: atmospheres / binaries: close / stars: low-mass
© ESO, 2017
1. Introduction
A persistent problem for our understanding of M dwarfs is that radii derived from the components of eclipsing binaries are larger than radii predicted by stellar models. In a review from an observer’s perspective, Torres (2013) reports discrepancies of 5−10% for the best measured systems. Somewhat smaller discrepancies ~3% are reported by Spada et al. (2013) when the data are compared to their newly computed evolutionary tracks for low-mass stars. Nevertheless, Spada et al. emphasize that the existence of the discrepacy is beyond doubt.
An important clue to the cause of inflated radii is that the discrepacy is larger for the components of short period binaries (Kraus et al. 2011; Spada et al. 2013). This has prompted the seemingly plausible suggestion (e.g., Lopez-Morales 2007; Chabrier et al. 2007; MacDonald & Mullan 2013) that enhanced dynamo activity due to synchronized rotation leads to stronger magnetic fields and hence inhibited convective energy transport in these star’s envelopes. But since a treatment of this effect from first principles is not yet feasible, a defintive test is not possible. Moreover, recent papers (Feiden & Chaboyer 2014; Browning et al. 2016) question the feasibility of the very strong fields required to achieve the observed inflation.
In this paper, another seemingly plausible possibility is investigated, namely that inflated radii in short-period low-mass binaries are due to the components’ mutual irradiation. An attractive aspect of this suggestion is that a treatment from first principles is not beyond our current theoretical understanding.
2. The model
A general treatment of the interaction of a close binary’s components requires the simultaneous solution of their rotationally- and tidally- distorted structures, with irradiation by each component incorporated into the photospheric boundary conditions of its companion. Although the relevant aspects of the theories of stellar structure and stellar atmospheres are well understood, this general problem is a formidable technical challenge. Accordingly, a severely simplified, tractable version is now defined.
The adopted model is illustrated in Fig. 1: a non-rotating, zero age main sequence (ZAMS) star is irradiated by a point source of luminosity L⋆ at separation a. In addition, the point source is massless and is not in orbit around the target star.
In adopting this model, rotational- and tidal distortions are eliminated, as is the complicating effect of mutual irradiation. Because of these simplifications, this model isolates the differential effect of irradiation.
Historically, discussions of irradiation in close binaries concern light curve perturbations (“the reflection effect”) and their impact on photometric elements (Eddington 1926; Milne 1926). Because of the fundamental importance of binary star data, this aspect of irradiation is now highly developed (e.g., Wilson 1990). Here a simpler treatment is adopted in order to incorporate irradiation into stellar structure calculations.
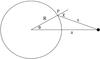 |
Fig. 1 Irradiation model. A non-rotating star of radius R is irradiated by a stationary point source of luminosity L⋆ at separation a. The critical angle θt separating the irradiated and dark segments is given by cosθt = υt = R/a, corresponding to irradiation at grazing incidence (χ = π/ 2). |
Model segments. Because the irradiating source is a point, there is a sharply defined terminator separating the irradiated and dark sides of the target star – i.e., there is no penumbral zone. In terms of polar coordinates with the point source at z = a, the terminator is the circle r = R,θ = θt, where R is the star’s radius, and cosθt = υt = R/a.
In addition to dividing the surface into two zones, we can conveniently use it to divide the entire structure into two segments: 1) an irradiated segment comprising all elements of the star with r ≤ R and θ ≤ θt; and 2) a dark segment comprising all elements with r ≤ R and θ>θt.
Thus defined, the irradiated and dark segments comprise the fractions 1−ζ and ζ of the star’s total surface area and volume, where  (1)Moreover, the conical contact surface between the two segments is defined by r ∈ (0,R),θ = θt.
3. Basic code
The starting point for the calculations reported in this paper is a standard Henyey stellar structure code for ZAMS stars.
3.1. Input physics
A brief summary of the input physics is as follows:
The composition is X = 0.70,Z = 0.02. A table of opacities (Rosseland mean coefficients) for this standard Population I composition was constucted using data downloaded from the Livermore (OPAL, Iglesias & Rogers 1996) and Wichita (Alexander & Ferguson 1994) websites. The Wichita opacities are adopted for log T ≤ 3.70 and the OPAL opacities for log T > 3.70.
Equation of state data was also downloaded from the Livermore (OPAL, Rogers et al. 1996) website. The data used is interpolated to the adopted composition from the OPAL files as updated on 22 Feb. 2006.
The outer convection zone is treated using the formulation of mixing-length theory presented by Kippenhahn et al. (2012). To facilitate comparison with the Yale models (Spada et al. 2013), their solar-calibrated value of the mixing-length ratio α = 1.875 is adopted.
Nuclear energy production also follows the treatment given in Kippenhahn et al. (2012).
One effect neglected here but taken into account in the Yale models is the gravitational settling of helium and heavy elements. Thus ZAMS models computed with the code described here are strictly homogeneous. But this neglect is of little concern since the code is used to quantify the differential effect of irradiation rather than to predict absolute values of fundamental parameters.
3.2. Photosphere
Non-grey effects are important in the atmospheres of M stars and must be taken into account in the surface boundary conditions (e.g. Baraffe et al. 2015, and references therein). On the other hand, grey atmosphere theory is a valuable simplification when incorporating irradiation. These conflicting considerations are reconciled by adopting grey atmosphere theory but calibrating the absorption coefficient so as to accurately match the photospheric pressure of non-grey models.
Let keff(Teff,g) denote the constant effective grey absorption coefficient within an atmosphere of effective temperature Teff and surface gravity g. In radiative equilibrium, the temperature stratification as a function of optical depth τ is well approximated with the Milne-Eddington formula  (2)In mechanical (hydrostatic) equilibrium, the corresponding pressure distribution is given by
  (3)A 2D tabulation of the function keff(Teff,g) is derived by fitting to the non-grey stellar atmospheres of Gustafsson et al. (2008). Specifically, models with solar composition and zero microturbulence were downloaded from the MARCS website. For each model, the layer with temperature T∗ closest to Teff is selected, and its Milne-Eddington optical depth τ∗ computed from Eq. (2). Then, if P∗ is the pressure of the selected layer, Eq. (3) is satisfied if keff = gτ∗/P∗. With this prescription, if we compute the structure of an atmosphere assuming mechanical equilibrium and a Milne-Eddington temperature stratification, the photospheric pressure will be almost exactly that of the corresponding MARCS model.
The accuracy of the derived values keff and the resulting photospheric pressures can be gauged from corresponding calculations with the less extensive grid of Castelli & Kurucz (2004). For Teff ∈ (3500,5500 K) and log g ∈ (4.0,5.0), the mean absolute difference in log keff = 0.031. However, for models at Teff = 3500 K and log g ∈ (4.0,5.0), the difference rises to 0.143.
Equations (2) and (3) evaluated at τ = 2/3 dermine the starting point (P,T) for inward envelope integrations. Effectively, with keff calibrated as described above, the starting point is derived from the MARCS models. In these inward integrations, the opacities are from the Wichita-OPAL data and convection is treated with mixing length theory (Sect. 3.1).
3.3. Model comparisons
The Yale evolutionary tracks discussed in Sect. 1 include nuclear burning during contraction to the main sequence, and so no point along these tracks corresponds exactly to classically-defined ZAMS models. Approximate ZAMS parameters can, however, be derived by selecting models at 5 Gyr – see Fig. 6 in Spada et al. (2013). These are then compared with ZAMS models computed with the code described above. The models agree closely at ℳ ~ 0.40−0.45 ℳ⊙ but less so towards smaller masses. Thus at ℳ = 0.2 ℳ⊙, the Yale track’s radius and luminosity are 6 and 13% smaller, respectively, than the present code’s ZAMS values.
3.4. Sub-photospheric convection
For later reference, some typical aspects of sub-photosperic convection in low-mass ZAMS stars are here noted. The ℳ = 0.4 ℳ⊙ model has Teff = 3582 K, and its atmosphere becomes convectively unstable at T = 3711 K – i.e., at τ = 0.87. Initially, the convective energy transport is weak, but with increasing depth quickly becomes efficient. Thus, 99% of the energy flux is carried by convection at T = 7428 K – i.e., τ = 11.7.
At yet greater depths, convection becomes highly efficient; the temperature gradient ∇ = dlog T/ dlog P then only slightly exceeds the adiabatic gradient ∇ad, and so the stratification is almost exactly isentropic. The departure from isentropy can be quantified as  (4)Thus at T = 105 K, η = 4.4 × 10⁻⁶. Moreover, convection becomes highly efficient with only a fractionally small penetration below the surface. Thus, at r/R = 0.99, the ratio η = 1.1 × 10⁻⁵. This implies that the entropy constant of the convection zone is to an excellent approximation a function of just Teff and g, and so can be derived with a plane-parallel calculation.
When convective transfer is efficient, the nearly exact isentropic stratification is effectively uncoupled from the total energy flux. Thus, for example, if the luminosity variable Lr were to be doubled due an injection of energy at r, the expected change in ∇ is ~η∇ad, and is thus negligible when η ≲ 10-5. The convective cores of massive stars exemplify this point: Lr increases with r due to nuclear burning and yet the isentropic approximation is superb since η ~ 10-6 (Schwarzschild 1958, p. 50).
4. Structure of the dark segment
The code described in Sect. 3 is now used to compute the structure of the dark segment.
4.1. Convection zone
The coupling of the dark and the irradiated segments of the target star occurs within their shared sub-photosperic convection zone in a manner similar to the coupling of the components of late-type contact binaries (Lucy 1968a). Thus, in an investigation (Lucy 1968b) of the light curves of these binaries, it was remarked that a treatment of the reflection effect requires that inward integrations of the equations governing atmospheric structure must all finish on the same adiabat. In the context of non-contact binaries – especially the secondaries of Algol systems – Rucinski (1969) investigated this effect in detail obtaining the important result that the bolometric albedo is ~0.4−0.5, thus providing a physical interpretation of the earlier empirical discovery by Hosokawa (1960).
The implication of a bolometric albedo less than the value unity expected for a radiative envelope (Eddington 1926) is that a lateral transfer of energy from the irradiated to the dark segment occurs within the shared convection zone. Indeed, Hosokawa inferred “that a circulation of matter on a large scale will occur through the superficial layers.”
Let the rate of energy transfer from the irradiated to the dark segment be ℒ. This transfer occurs across the contact surface between the segments. In consequence, the condition of thermal equilibrium for the dark segment must include this term. If Lnuc is the nuclear energy generation rate, and if  (5)where πFdrk is the emitted flux on the dark segment’s surface, then the condition of thermal equilibrium for the dark segment is
 (6)Now consider a radius vector within the dark segment – i.e. θ > θt. Deep in the convection zone below the zone of lateral energy exchange but exterior to the nuclear burning core, the luminosity variable Lr = Lnuc. But, as the radius vector reaches the surface, Lr = L† – i.e., an increase by
  (7)Accordingly, in computing the structure of the dark segment, it is convenient to define an equivalent single star with luminosity L†. But this star is not in thermal equilibrium because within its convection zone, Lr increases from Lnuc to L† = Lnuc + ΔL.
In the dark segment, the functional form of the increase of Lr from Lnuc to L† will depend on θ (Fig. 1). However, if we suppose that this increase occurs entirely within the zone where convection is efficient and if we take the isentropic limit, the functional form of this increase becomes irrelevant.
4.2. Luminosities and radii
To compute the structure of the equivalent single star, we simply modify the code described in Sect. 3 by introducing a jump ΔL in Lr at any point in the envelope where convection is efficient. In this way, for a given ℳ, a 1D sequence of models is created with luminosities L(ΔL;ℳ) = L† and radii R(ΔL;ℳ). These functions can be computed without specifying a or L⋆.
Because of the energy injection, the photospheric luminosity L† of the equivalent single star exceeds its nuclear luminosity Lnuc by the amount ΔL = ℒ /ζ. The divergence of L† and Lnuc with increasing ΔL is shown in Fig. 2 for ℳ = 0.4 ℳ⊙. A notable feature is that Lnuc drops markedly with increasing ΔL. Thus Lnuc drops by a factor of ~2 when ΔL increases to L0, the zero-age luminosity. Because of their deep convective envelopes with isentropic stratification, the internal structures of low-mass stars are not insensitive to the surface boundary condition. Here irradiation via the input ℒ implies a change in the surface boundary conditions resulting in a changed adiabat.
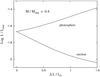 |
Fig. 2 Luminosities of the equivalent single star of mass 0.4 ℳ⊙ as functions of the parameter ΔL/L0, where L0 is the ZAMS luminosity. Plotted are the photospheric (L†) and nuclear (Lnuc) luminosities. Note that L† = Lnuc + ΔL. |
The corresponding changes in radii are plotted in Fig. 3 for ℳ/ℳ⊙ = 0.2(0.1)0.6. As expected, the effect of energy input is to inflate the dark segment’s radius.
Because of their intrinsic interest, the calculations reported in Fig. 3 explore the inflation effect far beyond inputs ΔL relevant for main sequence binaries. Examples of such enhanced inflation may eventually be found for the secondaries in sdB + dM binaries – see Heber (2016, Sect. 5.2) for a recent review.
For M dwarfs in main sequence binaries, radii inflated by up to 10% are reported (Sect. 1). From Fig. 3, we find that the radius of a 0.4 ℳ⊙ ZAMS star is inflated by 5% when ΔL = 7.27 × 10⁻³L⊙. But this is = 0.339L0, suggesting already that 5% inflation is highly unlikely when the companion is a main sequence star with mass comparable to that of the target star.
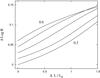 |
Fig. 3 Radius inflation due to irradiation. Δlog R is plotted against ΔL/L0 for masses ℳ = 0.2(0.1)0.6 ℳ⊙. Here ΔL is the increment in Lr within the convective envelope and L0 is the ZAMS luminosity for mass ℳ. For clarity, consecutive curves are displaced vertically by 0.015. |
5. Irradiated segment
The structure of the irradiated segment is now considered, with the aim of relating the energy input parameter ΔL = ℒ /ζ to the parameters L⋆ and a that define the irradiating source.
As noted in Sect. 4.1, this segment is coupled to the dark segment via their shared convection zone, and in which the gradient of entropy is negligible once the convection becomes efficient. Because this occurs at a fractionally small depth below the surface, curvature can be neglected and the entropy constant derived with a plane-parallel calculation (Sect. 3.4).
5.1. Incident flux
Consider the point P on the irradiated surface in Fig. 1. The incident flux due to the point source is  (8)where μ = cos(χ). The resulting incident luminosity is
  (9)Here
  is the fraction of sky filled by the target star when viewed from the point source. Note that
  (10)where υ = cosθ, and
  (11)where μ = cos(χ).
5.2. Plane-parallel photosphere
With the assumption of grey absorption, the temperature distribution in the irradiated atmosphere derived with Eddington’s approximations is (Sobieski 1965)  (12)where
  (13)and πFμ is the (unknown) flux propagating upwards from deep layers (τ → ∞).
5.3. Inward integrations
If we define the photosphere to be at τ = 2/3, the photospheric temperature Tph(μ) is given by the above formula as  (14)and the corresponding photospheric pressure is
  (15)where keff(Tph,g), the effective grey absorption coefficient defined in Sect. 3.2, is assumed to be constant for τ < 2/3.
Because irradiation still affects the temperature stratification for τ> 2/3, the sub-photospheric radiative gradient ∇rad is modified from the familiar diffusion formula. From Eqs. (12) and (13), we find that  (16)where the correction factor (Rucinski 1969) accounting for irradiation is
  (17)In order to compute Θ, the additional dependent variable τ is required. This is given by
  (18)with initial condition τ = 2/3 at (Pph,Tph), and where κ(ρ,T) is the Wichita-OPAL opacity (Sect. 3.1).
When the inward integration encounters convective instability, standard mixing length theory with the irradiation-corrected ∇rad is used to compute the actual gradient ∇. Note the implicit assumption that irradiation does not affect α, the mixing-length ratio.
Given  and g, the initial conditions T = Tph, P = Pph and τ = 2/3 allow an inward integration of the equations governing the structure of the sub-photosperic layers as modified by irradiation. But Fμ is not known; it is determined by the condition that the entropy constant when convection is efficient has the same value as in the corresponding integration on the dark side. In effect, Fμ is an eigenvalue determined by this extra constraint.
Note that with Fμ = Fdrk and Finc = 0, the above formulae determine the structure of the photospheric and sub-photospheric layers on the dark side.
5.4. Energy transfer to dark segment
From the definition of the bolometric albedo Aμ given in Eq. (A.1), it follows that the outward flux at point P in Fig. 1 is  Accordingly, the luminosity of the irradiated segment is
  (19)where ⟨ Aμ ⟩ is the mean bolometric albedo defined by Eq. (A.2) and L† is defined by Eq. (5).
Now, if the irradiated segment is in thermal equilibrium,  (20)and if the dark segment is in thermal equilibrium Eq. (6) holds. Combining these two equilibrium constraints with Eq. (19), we obtain
  (21)as the rate of energy transfer from the irradiated to the dark segment. For fixed ⟨ Aμ ⟩ and L⋆, Eqs. (9) and (21) imply that ℒ ∝ ζW, a monotonically decreasing function of a/R as expected.
If we use Eq. (21) to eliminate ℒ from Eq. (6), we obtain  (22)which is the condition that the irradiated star is in overall thermal equilibrium.
Note that the assumption that the target star is in thermal equilibrium is not necessary in deriving Eq. (21). If the radius rℓ is below the layers in which the energy transfer occurs and if the layers between rℓ and the surface are in thermal equilibrium, then the above analysis holds with Lℓ replacing Lnuc. Accordingly, since the layers in question are of negligible mass, the irradiation modification to stellar structure presented here is also applicable when Lℓ ≠ Lnuc – i.e., to rapid phases of stellar evolution.
5.5. An example
Consider a detached close binary comprising identical zero-age stars of mass 0.4 ℳ⊙ separated by a = 3 R0. With irradiation neglected, these stars have L0 = 0.215 L⊙, R0 = 0.380 R⊙, Teff = 3582 K, and log g = 4.880.
Treating one of these stars as a point source with L⋆ = 0.215 L⊙ and neglecting the radius inflation of the target star, we calculate ℒ as follows:
-
1)
Given Teff and log g, the stratification of the dark-side is obtained with inward integrations as described in Sect. 5.3 – i.e., with Finc = 0 and
 . The integration is continued until T = 105 K, well into the zone of efficient convection (Sect. 3.4), so that the adiabat’s entropy constant Sdrk is accurately determined.
 -
2)
Given a value of υ ∈ (υt,1), the incident flux
 is given by Eq. (8) with x and μ from Eqs. (10) and (11). Then with an initial guess for the eigenvalue Fμ, the stratification of the irradiated atmosphere is determined as described in Sect. 5.3. The integration is continued until T = 105 K and the specific entropy constant S(Fμ) determined. In general, S(Fμ) ≠ Sdrk, so that iterative adjustments of Fμ are required. Iterations with the bisection method determine Fμ with high accuracy.
 -
3)
Step 2) is repeated for numerous values of υ so that Lirr and ⟨ Aμ ⟩ given by Eqs. (19) and (A.2) can be evaluated numerically. Substitution in Eq. (21) then gives ℒ.
The result is ℒ = 3.06 × 10⁻⁴L⊙. Now, with ζ = 2/3 from Eq. (1), substitution in Eq. (7) gives ΔL = 4.59 × 10⁻⁴L⊙. This is to be compared with the value 7.27 × 10⁻³L⊙ found in Sect. 4.2 to be required to inflate the radius of a 0.4 ℳ⊙ ZAMS star by 5%. Thus, the computed ΔL falls short by the factor 0.063.
The energy transferred to the dark segment originates from the energy incident from the point source. It follows that ℒ ≤ Linc. Now, from Eq. (8), Linc = 6.14 × 10⁻⁴L⊙, so that ℒ /Linc = 0.498. Accordingly, even if this ratio were increased to unity, the resulting ΔL would still fall far short of reaching the 5% threshold. This demonstrates that a non-grey treatment of irradiation cannot markedly enhance radius inflation.
6. Consistent models
In Sect. 5.5, the irradiation-induced energy transfer rate ℒ is computed with the radius of the target star fixed at its value in the absence of irradiation. The aim now is to eliminate this inconsistency. This is achieved as follows:
-
1)
ΔL is specified and the structure of the equivalent single star computed as in Sect. 4.2. This gives the inflated radius R(ΔL,ℳ) as well as Teff and g of the dark segment.
-
2)
With the specified a and a trial value of L⋆, the value of ℒ is derived as in Sect. 5.5.
-
3)
With ζ from Eq. (1), the value of ΔL is computed from Eq. (7). In general, this differs from the value specified in step 1). The trial value of L⋆ in step 2) is therefore iteratively adjusted to achieve consistency.
6.1. A sequence with increasing L⋆
To investigate the dependence of radius inflation on the strength of the source, a 1D sequence of consistent models is computed with fixed a but increasing L⋆. Specifically, the target is a 0.4 ℳ⊙ ZAMS star with the point source at distance a = 3 R0.
The resulting radii R(L⋆;ℳ,a) are plotted in Fig. 4. As L⋆ increases, the quantities ℒ and ΔL = ℒ /ζ increase, resulting in the plotted monotonically increasing radii. For L∗/L0 ≲ 4, the plot is accurately linear, giving the approximation 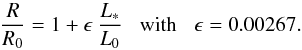 (23)Since low-mass stars are also found as companions of luminous primaries, e.g., sdB + dM binaries, Fig. 4 is extended way beyond L⋆ ~ L0 appropriate for binaries with M dwarf components. Interestingly, these high L⋆ solutions reveal a saturation effect. Thus, beyond ~4% inflation at L⋆ ~ 60L0, a further increase in L⋆ generates only small increases in radius. This arises because, although the energy transfer rate ℒ and therefore also ΔL increase monotonically with L⋆, the ratio ℒ /Linc decreases. Thus, as L⋆/L0 increases from 1.0 to 478, the ratio ℒ /Linc decreases from 0.49 to 0.016 – i.e., the efficiency with which incident energy is converted into energy flow into the dark segment declines as irradiation increases.
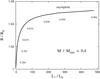 |
Fig. 4 Radius inflation of a 0.4 ℳ⊙ ZAMS star due to irradiation by a point source of luminosity L⋆ at distance a = 3 R0. Values of the mean bolometric albedo ⟨ Aμ ⟩ are indicated. The asymptotic limit corresponds to a radius inflation of 5.48%. |
This decline in efficiency originates in the structural changes of the irradiated segment’s surface layers as Linc increases. These result in an increasing mean albedo ⟨ Aμ ⟩ – see Fig. 4. Thus, the conversion efficiency declines because an increasing fraction of Linc is radiated back into space.
Figure 5 illustrates the structural changes at various points on the irradiated segment’s surface at the onset of the saturation effect. This is taken to be the point where R/R0 = 1.04, corresponding to L⋆/L0 = 57.5 or Linc/L0 = 1.78 – i.e., an O(1) perturbation. These log P−log T plots show that the irradiated solutions peel away from dark segment solution at depths that increase with μ. Moreover, the optical depths of the onset of convection increase from τc = 0.868 for the dark segment to 1.03 × 10⁴ when the source is at the zenith (μ = 1). From additional such solutions, we find that τc> 5 when μ> 0.236. Thus, for μ ≳ 0.24, corresponding to ~69% of the area of the irradiated surface, the incident radiation does not penetrate to the convection zone, and so the local bolometric albedo Aμ should be close to unity (Eddington 1926). This partial shielding of the convection zone by optically-thick radiative zones created by strong irradiation explains why ⟨ Aμ ⟩ → 1 as L⋆/L0 → ∞.
In addition to limiting the amount of radius inflation, the saturation effect limits the irradiation-induced reduction in nuclear luminosity (Fig. 2). From Fig. 4, R/R0 = 1.052 at L⋆/L0 = 479, and this solution corresponds to ΔL/L0 = 0.35. From Fig. 2, we find that the resulting drop in Lnuc is by 23%.
The convergence of solutions to the same adiabat is evident in Fig. 5, and this illustrates the criterion (Sect. 5.3) that determines the eigenvalues Fμ. But the solutions do not overlap when convection is inefficient or absent. This necessarily implies non-vanishing horizontal pressure gradients in these layers giving rise to an irradiation-driven circulation separate from that transporting energy between the segments in the deep convective layers (Sect. 4.1). This failure of rigorous mechanical equilibrium in the outermost layers was earlier (Lucy 1967) pointed out for the corresponding gravity-darkening problem. Nevertheless, because energy transport by flows in the low density surface layers is negligible, the conclusion that strong irradiation implies ⟨ Aμ ⟩ → 1 is likely to survive a more rigorous analysis.
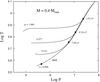 |
Fig. 5 Log P – Log T plots for sub-photospheric layers at three points on the surface of the irradiated segment as well as for the dark segment. The incident direction cosines μ are indicated. The filled circles locate the onset of convection at the indicated optical depths τ. These plots correspond to the point L⋆/L0 = 57.5,R/R0 = 1.04 in Fig. 4 where the mean albedo ⟨ Aμ ⟩ = 0.834. |
6.2. Asymptotic theory
Figure 4 strongly suggests that R/R0 tends to some finite value as L∗/L0 → ∞.
A clue to the derivation of this asymptote is found in Fig. 5. Prior to the onsets of convection, the slopes of these plots are the radiative gradients ∇rad. Since the gradients are near zero – i.e., almost isothermal stratifications, the radiative fluxes are small, showing that irradiation severely inhibits the escape of the internally-generated Lnuc. Extrapolating to infinite L∗, we expect zero escape of nuclear energy over the entire irradiated surface. Accordingly, in this limit, all energy released by nuclear burning is radiated by the dark segment, and so the asymptote is such that (24)Substitution in Eq. (6) then gives
  (25)confirming that the energy flow rate in the convection zone from the irradiated to the dark segment is indeed the nuclear burning rate in the irradiated segment. Finally, substituting in Eq. (7), we find that the required jump in the luminosity variable in the convection zone of the equivalent single star (Sect. 4.2) is
  (26)Accordingly, the asymptote is derived by computing a sequence of equivalent single stars as in Figs. 2 and 3 and iterpolating to find the solution of Eq. (26).
For ℳ = 0.4 ℳ⊙, Eq. (26) is satisfied when ΔL = 0.366L0, giving asymptotic inflation of 5.48%, corresponding to ζ1 = 0.676.
Throughout this paper, the irradiating source is a point at finite distance – Fig. 1. In an even simpler model, the source is at infinity (a → ∞), in which case the target star is irradiated by a parallel beam of intensity S, and the irradiated fraction ζ2 = 0.5. In the limit S → ∞, the nuclear burning is again radiated entirely from the dark segment – i.e., from exactly one hemisphere. The solution of Eq. (26) in this case occurs when ΔL = 0.633L0, giving asymptotic inflation of 10.6%. This increase in asymptotic inflation is a consequence of the increase by the factor (1−ζ1)/(1−ζ2) = 1.54 in the surface area from which escape of Lnuc is blocked.
Note that there is obviously a close analogy between blocking by the effect of external radiation and the blocking that manifests itself as starspots. Thus a single ℳ = 0.4 ℳ⊙ ZAMS star would experience 10.6% radius inflation if 50% of its surface were covered by perfectly black star spots.
6.3. Equal mass binaries
Of special interest in Fig. 4 is the solution for L⋆ = L0 since this corresponds to irradiation by a close companion of equal mass. In this case, the fractional radius inflation (R−R0) /R0 is only 0.0026 despite a fractional perturbation Linc/L0 = 0.029. This confirms the earlier conclusion (Sect. 4.2) that the observed inflations of ~5% cannot be achieved by irradiation from similar mass companions.
To check the generality of this conclusion for low-mass binaries with main sequence components, solutions for ℳ/ℳ⊙ = 0.2(0.1)0.6 are reported in Table 1. In each case, L⋆ = L0(ℳ) and a = 3R0. These further support the conclusion that inflation-induced inflation of the components’ radii are too small by more than an order of magnitude to explain the values inferred from observational data (Sect. 1).
Irradiated low-mass ZAMS stars.
7. Summary
The aim of this paper is to quantify the radius inflation of the components of low-mass binaries due to their mutual irradiation. The motivation is to test whether this effect can significantly contribute to explaining the well-established disagreements between the radii derived from eclipsing binaries and the radii of stellar models (Sect. 1).
In order to predict the inflationary effect of irradiation, the classical stellar structure boundary condition of no inwardly-directed radiation at τ = 0 must be abandoned. In its place, a boundary condition is derived by considering irradiation by a point source (Sect. 2, Fig. 1) and exploiting a treatment of the temperature stratification in the surface layers previously-developed for photometric analyses of eclipsing binaries (Sect. 5).
A crucial element in the structure of the irradiated star is the energy transfer that occurs within the convection zone from the irradiated to the dark segment (Sect. 5.4). This transfer is induced by the irradiation, and its rate derives from the constraint of zero entropy gradient within the simply-connected zone of efficient convection which lies beneath the irradiated and non-irradiated surface layers. The luminosity increment within the dark segment resulting from this energy transfer inflates the star’s radius (Sect. 4). A consistent model is achieved when the energy intercepted by the inflated star induces exactly the energy transfer required to produce the inflated radius (Sect. 6).
A sequence of consistent models appropriate for low-mass zero-age close binaries is reported in Table 1. The inflated radii are ≲0.4%, considerably smaller than the claimed discrepancies (Sect. 1), and so unlikely to be eliminated by introducing such refinements as a finite-sized irradiation source or a non-grey treatment of the reflection effect. Accordingly, the observed inflated radii remain unexplained.
Acknowledgments
I thank the referee, D. Homeier, whose pertinent comments improved the paper.
References
- Alexander, D. R., & Ferguson, J. W. 1994, ApJ, 437, 879 [NASA ADS] [CrossRef] [Google Scholar]
- Baraffe, I., Homeier, D., Allard, F., & Chabrier, G. 2015, A&A, 577, A42 [NASA ADS] [CrossRef] [EDP Sciences] [Google Scholar]
- Browning, M. K., Weber, M. A., Chabrier, G., & Massey, A. P. 2016, ApJ, 818, 189 [NASA ADS] [CrossRef] [Google Scholar]
- Castelli, F., & Kurucz, R. L. 2004, ArXiv e-prints [arXiv:astro-ph/0405087] [Google Scholar]
- Chabrier, G., Gallardo, J., & Baraffe, I. 2007, A&A, 472, L17 [NASA ADS] [CrossRef] [EDP Sciences] [Google Scholar]
- Eddington, A. S. 1926, MNRAS, 86, 320 [NASA ADS] [Google Scholar]
- Feiden, G. A., & Chaboyer, B. 2014, ApJ, 789, 53 [NASA ADS] [CrossRef] [Google Scholar]
- Gustafsson, B., Edvardsson, B., Eriksson, K., et al. 2008, A&A, 486, 951 [NASA ADS] [CrossRef] [EDP Sciences] [Google Scholar]
- Heber, U. 2016, PASP, 128, 082001 [NASA ADS] [CrossRef] [Google Scholar]
- Hosokawa, Y. 1960, PASJ, 12, 127 [NASA ADS] [Google Scholar]
- Iglesias, C. A., & Rogers, F. J. 1996, ApJ, 464, 943 [NASA ADS] [CrossRef] [Google Scholar]
- Kippenhahn, R., Weigert, A., & Weiss, A. 2012, Stellar Structure and Evolution (Springer: Heidelberg) [Google Scholar]
- Kraus, A. L., Tucker, R. A., Thompson, M. I., Craine, E. R., & Hillenbrand, L. A. 2011, ApJ, 728, 48 [NASA ADS] [CrossRef] [Google Scholar]
- Lopez-Morales, M. 2007 ApJ, 660, 732 [NASA ADS] [CrossRef] [Google Scholar]
- Lucy, L. B. 1967, Z. Astrophys., 65, 89 [Google Scholar]
- Lucy, L. B. 1968a, ApJ, 151, 1123 [NASA ADS] [CrossRef] [Google Scholar]
- Lucy, L. B. 1968b, ApJ, 153, 877 [NASA ADS] [CrossRef] [Google Scholar]
- MacDonald, J., & Mullan, D. J. 2013, ApJ, 765, 126 [NASA ADS] [CrossRef] [Google Scholar]
- Milne, E. A. 1926, MNRAS, 87, 43 [Google Scholar]
- Rogers, F. J., Swenson, F. J., & Iglesias, C. A. 1996, ApJ, 456, 902 [NASA ADS] [CrossRef] [Google Scholar]
- Rucinski, S. M. 1969, Acta Astron., 19, 245 [Google Scholar]
- Schwarzschild, M. 1958, Structure and Evolution of the Stars (Dover: New York) [Google Scholar]
- Sobieski, S. 1965, ApJS, 12, 263 [NASA ADS] [CrossRef] [Google Scholar]
- Spada, F., Demarque, P., Kim, Y.-C., & Sills, A. 2013, ApJ, 776, 87 [NASA ADS] [CrossRef] [Google Scholar]
- Torres, G. 2013, Astron. Nachr., 334, 4 [NASA ADS] [CrossRef] [Google Scholar]
- Wilson, R. E. 1990, ApJ, 356, 613 [NASA ADS] [CrossRef] [Google Scholar]
Appendix A: Bolometric albedo
In deriving photometric elements of eclipsing binaries with a cool component, the reflection effect is commonly taken into account with a bolometric albedo of 0.4–0.5 following Rucinski (1969). As emphasized by Rucinski, the reflection effect in a photometric analysis relates to the enhancement of the flux  from the irradiated surface above that on the dark side Fdrk, since an isotropic change due to the changed internal structure (Fig. 2) is not observed as a photometric perturbation. Accordingly, at point P in Fig. 1, the bolometric albedo is defined to be
  (A.1)and, since
  , its determination is trivial once the eigenvalue Fμ has been found (Sect. 5.5).
Because the μ-dependence of Aμ is not readily inferred in a photometric analysis, it is useful to define a mean albedo. A natural choice is the mean obtained by weighting Aμ by  and averaging over the irradiated surface. Thus, we define
  (A.2)Substituting Aμ from Eq. (A.1) and making use of Eqs. (1), (5), (9) and (19), we find that
  (A.3)where
  is the luminosity of the irradiated segment when
  .
.
In the limit a/R → ∞, we have υ → μ so that  , where
  (A.4)If we further suppose that Linc ≪ L0, then
  is just a function of the stellar atmosphere parameters Teff and g.
All Tables
All Figures
|
Fig. 1 Irradiation model. A non-rotating star of radius R is irradiated by a stationary point source of luminosity L⋆ at separation a. The critical angle θt separating the irradiated and dark segments is given by cosθt = υt = R/a, corresponding to irradiation at grazing incidence (χ = π/ 2). |
| In the text | |
|
Fig. 2 Luminosities of the equivalent single star of mass 0.4 ℳ⊙ as functions of the parameter ΔL/L0, where L0 is the ZAMS luminosity. Plotted are the photospheric (L†) and nuclear (Lnuc) luminosities. Note that L† = Lnuc + ΔL. |
| In the text | |
|
Fig. 3 Radius inflation due to irradiation. Δlog R is plotted against ΔL/L0 for masses ℳ = 0.2(0.1)0.6 ℳ⊙. Here ΔL is the increment in Lr within the convective envelope and L0 is the ZAMS luminosity for mass ℳ. For clarity, consecutive curves are displaced vertically by 0.015. |
| In the text | |
|
Fig. 4 Radius inflation of a 0.4 ℳ⊙ ZAMS star due to irradiation by a point source of luminosity L⋆ at distance a = 3 R0. Values of the mean bolometric albedo ⟨ Aμ ⟩ are indicated. The asymptotic limit corresponds to a radius inflation of 5.48%. |
| In the text | |
|
Fig. 5 Log P – Log T plots for sub-photospheric layers at three points on the surface of the irradiated segment as well as for the dark segment. The incident direction cosines μ are indicated. The filled circles locate the onset of convection at the indicated optical depths τ. These plots correspond to the point L⋆/L0 = 57.5,R/R0 = 1.04 in Fig. 4 where the mean albedo ⟨ Aμ ⟩ = 0.834. |
| In the text | |
Current usage metrics show cumulative count of Article Views (full-text article views including HTML views, PDF and ePub downloads, according to the available data) and Abstracts Views on Vision4Press platform.
Data correspond to usage on the plateform after 2015. The current usage metrics is available 48-96 hours after online publication and is updated daily on week days.
Initial download of the metrics may take a while.