Fig. 5
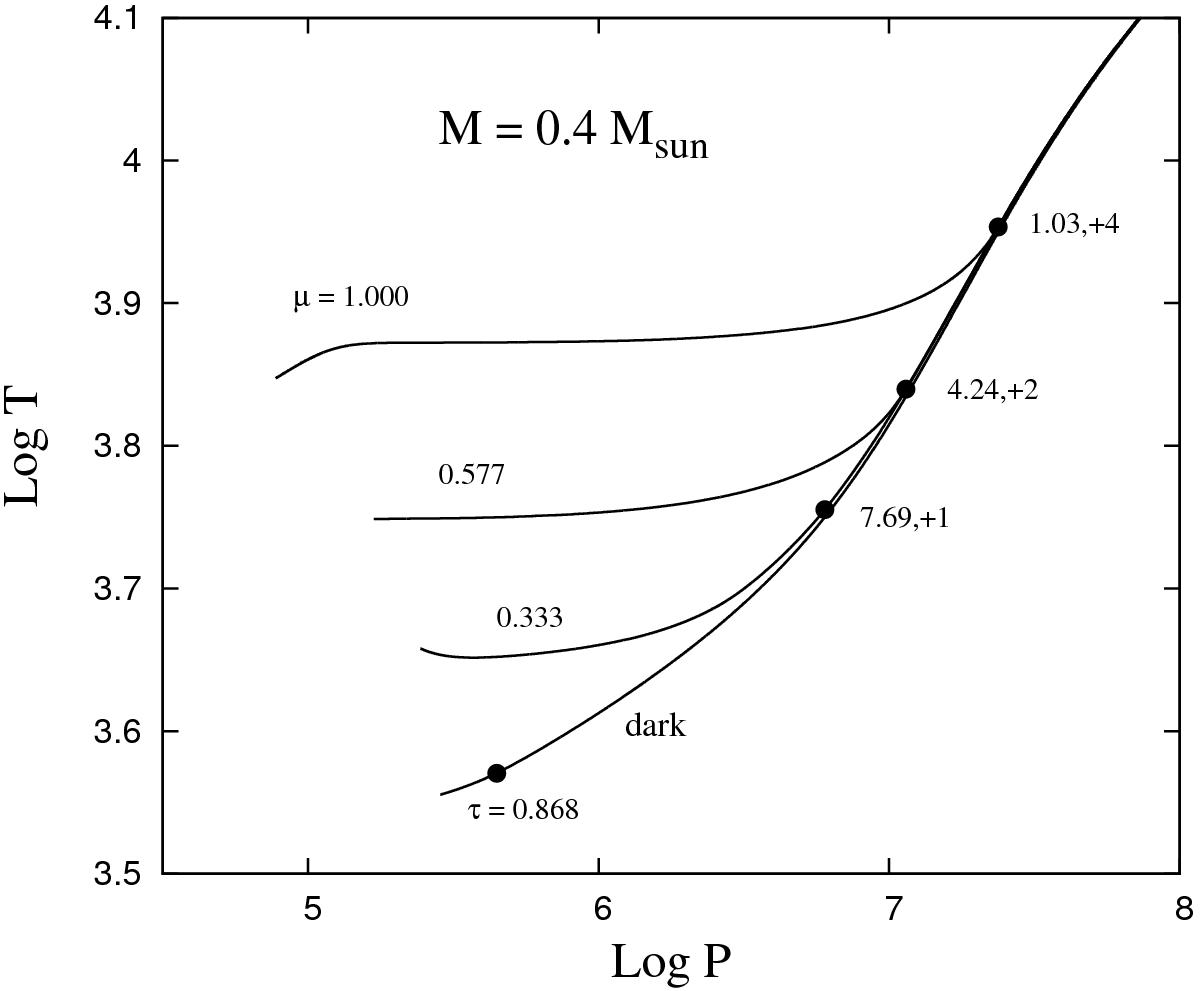
Log P – Log T plots for sub-photospheric layers at three points on the surface of the irradiated segment as well as for the dark segment. The incident direction cosines μ are indicated. The filled circles locate the onset of convection at the indicated optical depths τ. These plots correspond to the point L⋆/L0 = 57.5,R/R0 = 1.04 in Fig. 4 where the mean albedo ⟨ Aμ ⟩ = 0.834.
Current usage metrics show cumulative count of Article Views (full-text article views including HTML views, PDF and ePub downloads, according to the available data) and Abstracts Views on Vision4Press platform.
Data correspond to usage on the plateform after 2015. The current usage metrics is available 48-96 hours after online publication and is updated daily on week days.
Initial download of the metrics may take a while.