Free Access
Fig. 3
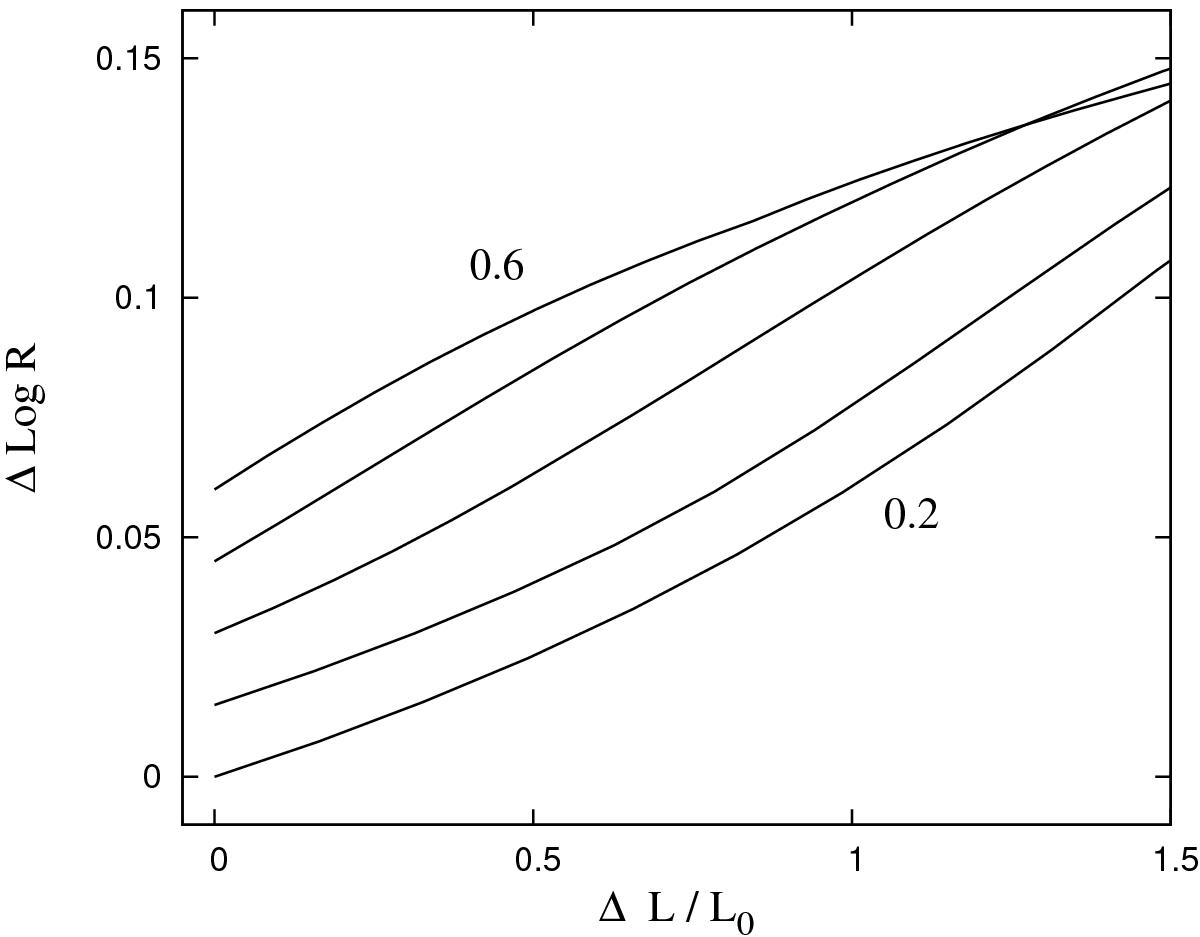
Radius inflation due to irradiation. Δlog R is plotted against ΔL/L0 for masses ℳ = 0.2(0.1)0.6 ℳ⊙. Here ΔL is the increment in Lr within the convective envelope and L0 is the ZAMS luminosity for mass ℳ. For clarity, consecutive curves are displaced vertically by 0.015.
Current usage metrics show cumulative count of Article Views (full-text article views including HTML views, PDF and ePub downloads, according to the available data) and Abstracts Views on Vision4Press platform.
Data correspond to usage on the plateform after 2015. The current usage metrics is available 48-96 hours after online publication and is updated daily on week days.
Initial download of the metrics may take a while.