Fig. 7

Download original image
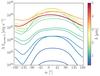
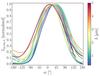
Left: emitted light spectral energy distribution λLp,em,λ (Eq. (37)) of our HD 189733b simulation phase curves between 0.3 μm (colour bar: dark purple) to 5.0 μm (colour bar: dark red). Infrared wavelengths from 3−5 μm dominate the emission luminosity at all phases. Right: normalised (to maximum λLp,em,λ) spectral energy distribution phase curves to emphasise the phase curve shapes. All wavelengths show a α≥ 10° eastward offset from the sub-stellar point.
Current usage metrics show cumulative count of Article Views (full-text article views including HTML views, PDF and ePub downloads, according to the available data) and Abstracts Views on Vision4Press platform.
Data correspond to usage on the plateform after 2015. The current usage metrics is available 48-96 hours after online publication and is updated daily on week days.
Initial download of the metrics may take a while.