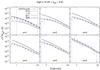
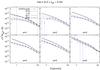
Fig. 4

Measurements of the G3L aperture statistics as a function of the aperture scale θ in CFHTLenS (blue symbols) and SAMs (black curves). Measurements are presented for various stellar mass and redshift, high-z and low-z, samples. Error bars indicate the standard error of the mean. The dotted vertical lines show the limits of the range used for our χ2 analysis.
Current usage metrics show cumulative count of Article Views (full-text article views including HTML views, PDF and ePub downloads, according to the available data) and Abstracts Views on Vision4Press platform.
Data correspond to usage on the plateform after 2015. The current usage metrics is available 48-96 hours after online publication and is updated daily on week days.
Initial download of the metrics may take a while.