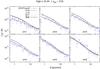
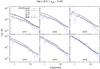
Fig. 3

GGL as a function of the projected separation for the six stellar mass samples according to Table 1. The top panel corresponds to the high-z sample and the bottom panel to the low-z sample. The data points with error bars, which indicate the standard error of the mean over 129 fields, show the CFHTLenS measurements, which are compared to the predictions by B06 (solid lines), G11 (dashed lines), L12 (double-dashed lines), and H15 (dashed-dotted lines). The B06 predictions for sm1 show the error of the mean over 64 fields.
Current usage metrics show cumulative count of Article Views (full-text article views including HTML views, PDF and ePub downloads, according to the available data) and Abstracts Views on Vision4Press platform.
Data correspond to usage on the plateform after 2015. The current usage metrics is available 48-96 hours after online publication and is updated daily on week days.
Initial download of the metrics may take a while.