Fig. 9
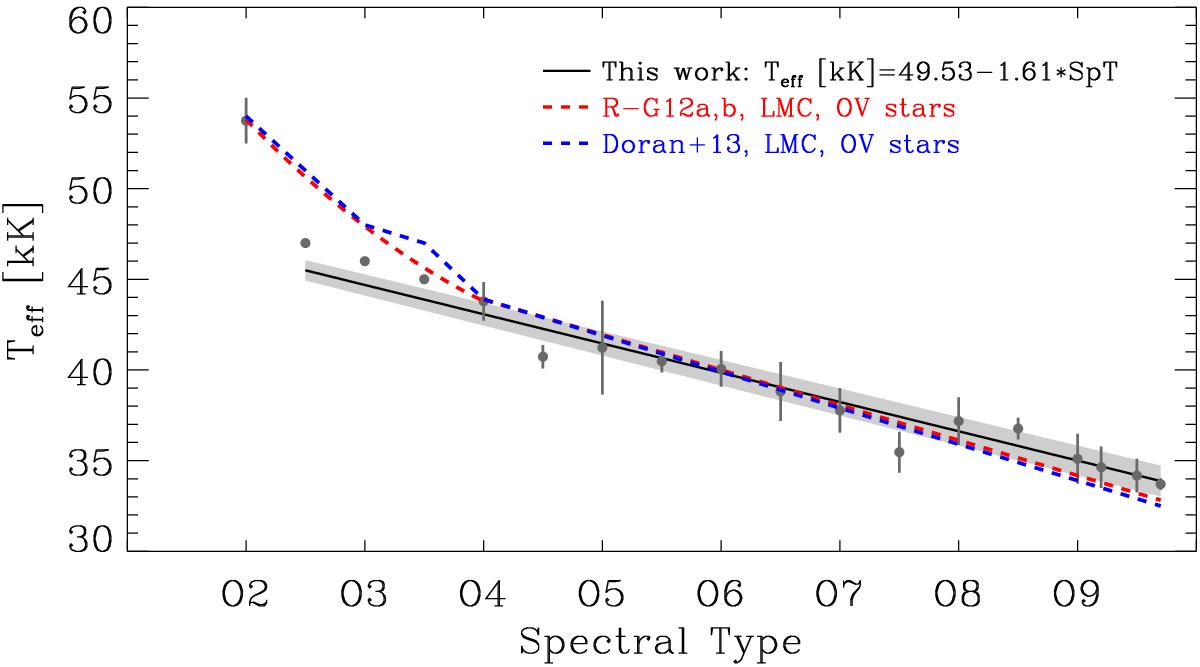
Comparison of our Teff calibration for O dwarfs in the LMC with those derived by Rivero González et al. (2012a,b) and adopted by Doran et al. (2013). Grey dots and bars represent the mean value and standard deviation of our Teff estimates for each spectral type, with our linear fit shown by the black line (and the grey zones indicating the associated uncertainties).
Current usage metrics show cumulative count of Article Views (full-text article views including HTML views, PDF and ePub downloads, according to the available data) and Abstracts Views on Vision4Press platform.
Data correspond to usage on the plateform after 2015. The current usage metrics is available 48-96 hours after online publication and is updated daily on week days.
Initial download of the metrics may take a while.