Fig. 5
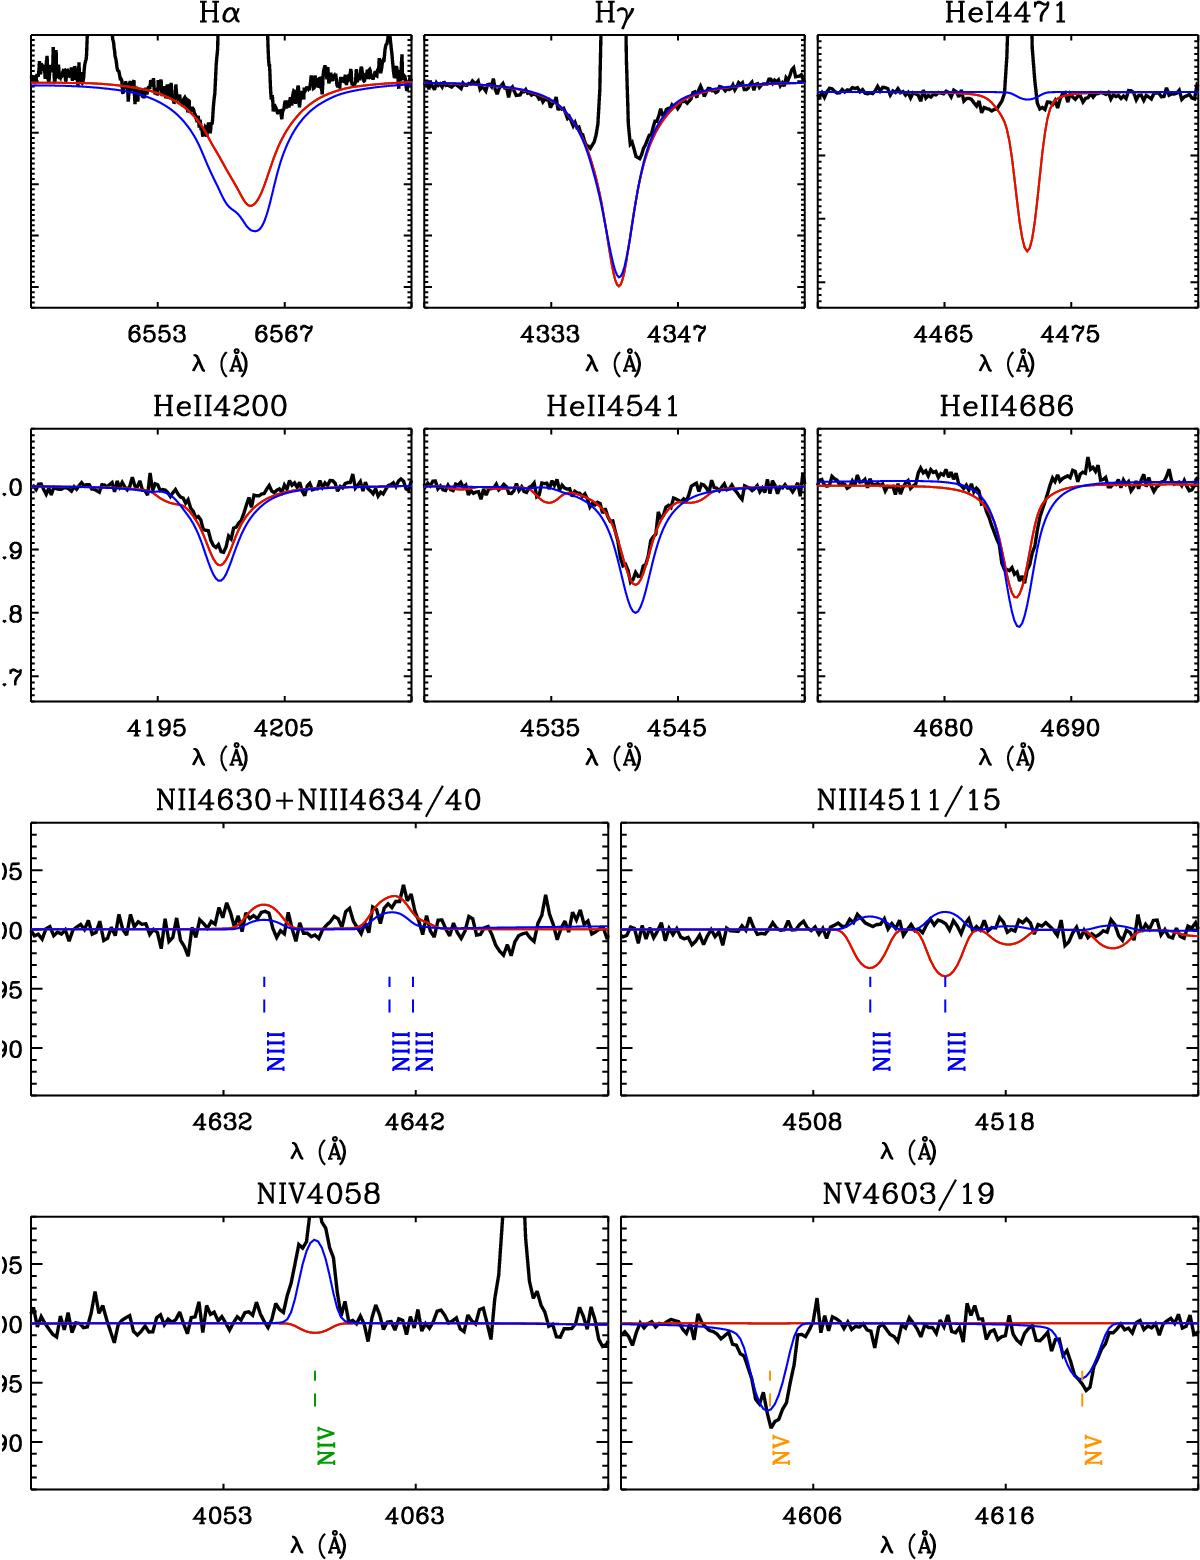
Model fits to the spectrum of VFTS 621, with the best fit from the HHe (Teff = 36 kK, log g = 3.8) and HHeN (Teff = 54 kK, log g = 4.2) analyses shown in red and blue, respectively. The log Q as well as the helium and nitrogen abundances are the same in both models. These single-star models both suffer deficiencies that are suggestive of a composite observed spectrum, as seen in HST images (Fig. 4).
Current usage metrics show cumulative count of Article Views (full-text article views including HTML views, PDF and ePub downloads, according to the available data) and Abstracts Views on Vision4Press platform.
Data correspond to usage on the plateform after 2015. The current usage metrics is available 48-96 hours after online publication and is updated daily on week days.
Initial download of the metrics may take a while.