Fig. 15
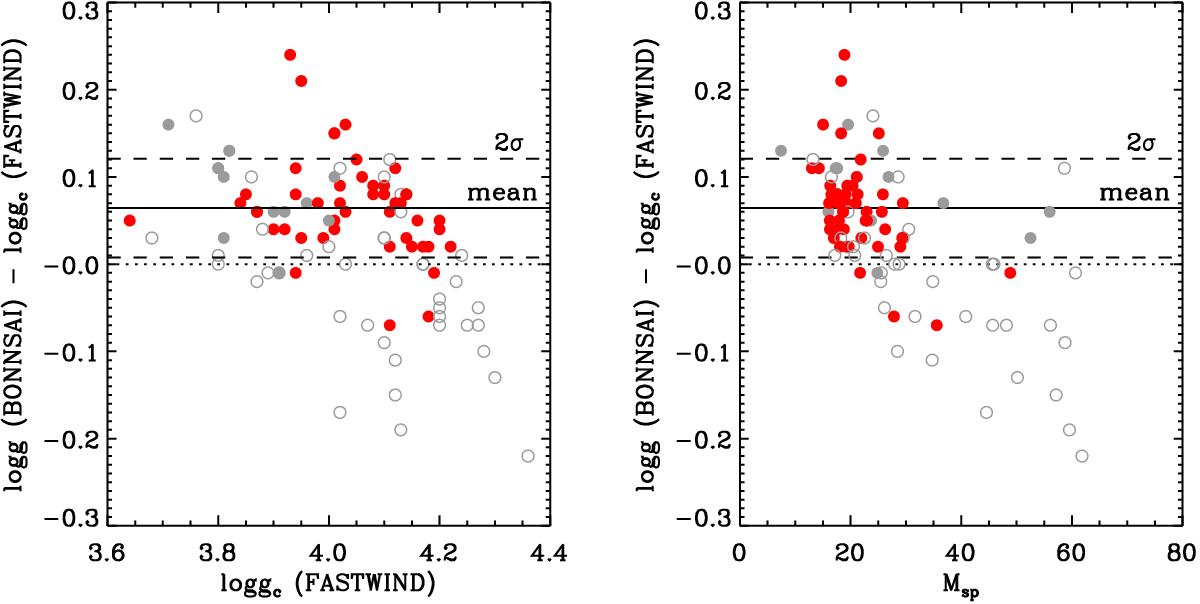
Differences between gravities derived from bonnsai and those obtained from the spectroscopic analysis (log gc) as a function of the latter (left-hand panel) and spectroscopic mass (Msp, right-hand panel). The dashed lines mark the ±2σ region used to calculate the mean differences; symbols have the same meaning as in Fig. 14. O2 stars were excluded.
Current usage metrics show cumulative count of Article Views (full-text article views including HTML views, PDF and ePub downloads, according to the available data) and Abstracts Views on Vision4Press platform.
Data correspond to usage on the plateform after 2015. The current usage metrics is available 48-96 hours after online publication and is updated daily on week days.
Initial download of the metrics may take a while.