Fig. 14
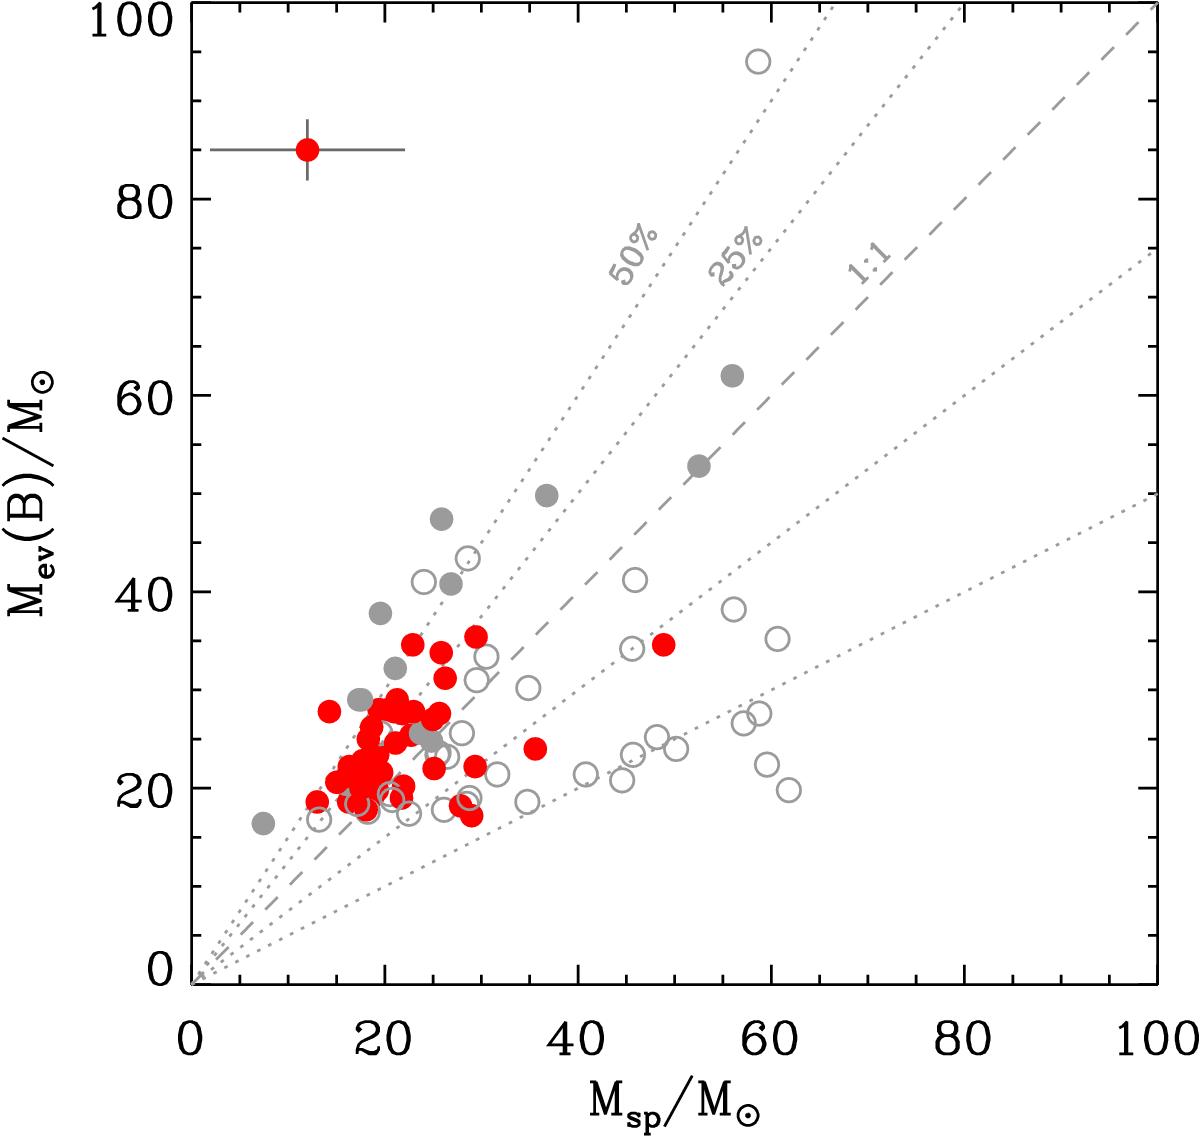
Evolutionary-mass estimates from bonnsai (Mev(B)) vs. spectroscopic masses (Msp). Grey open symbols: possible single-lined spectroscopic binaries (Sana et al. 2013; Walborn et al. 2014), stars with poor fits to He lines, high gravities (log g > 4.2) or low helium abundance, and objects with possible or confirmed fibre contamination. Filled grey symbols: objects from HHeN analysis and no indications of binarity or fibre contamination. Red symbols: rest of the sample. The dashed grey line indicates the one-to-one relation, with ±25 and ±50% shown by the dotted lines. Typical error bars are given in the upper left corner. O2 stars were excluded.
Current usage metrics show cumulative count of Article Views (full-text article views including HTML views, PDF and ePub downloads, according to the available data) and Abstracts Views on Vision4Press platform.
Data correspond to usage on the plateform after 2015. The current usage metrics is available 48-96 hours after online publication and is updated daily on week days.
Initial download of the metrics may take a while.