Fig. 13
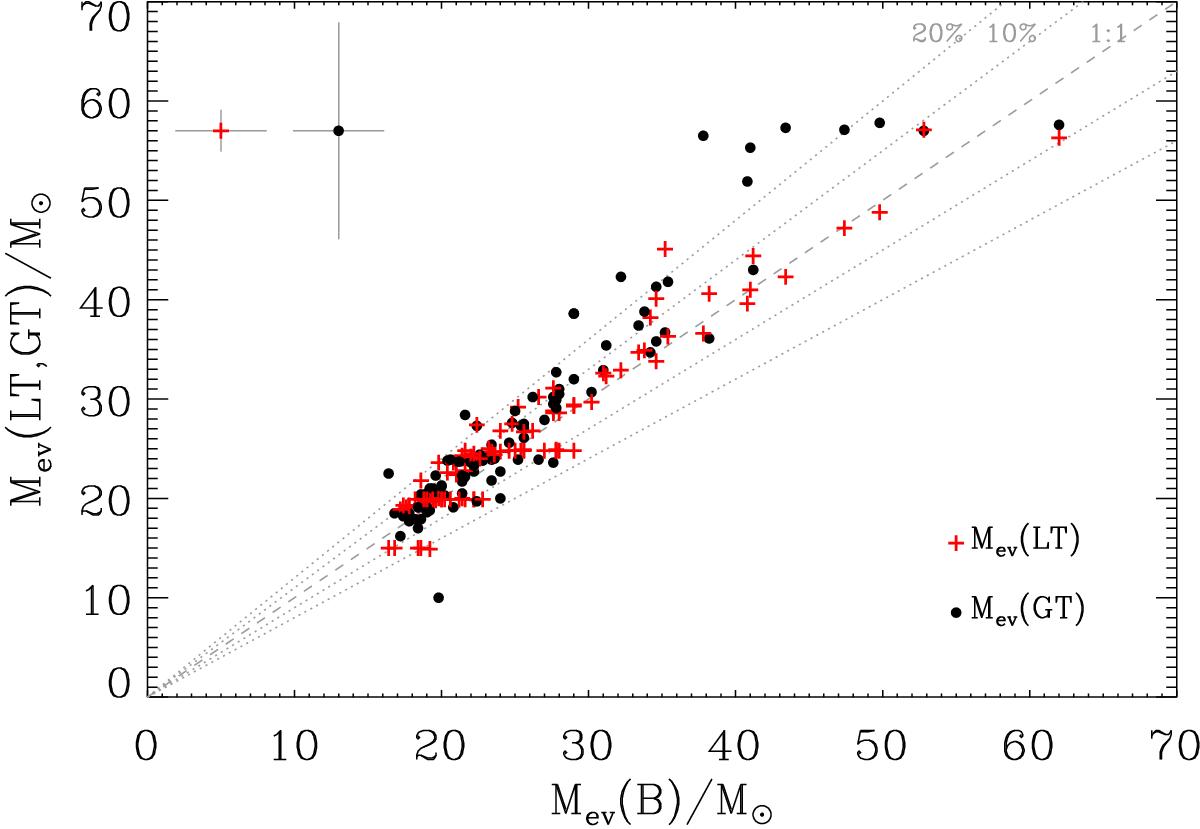
Evolutionary masses (Mev) estimated using the H–R (Mev(LT), red crosses) and Kiel diagrams (Mev(GT), black dots) compared to those from bonnsai (Mev(B)). Error bars are shown in the upper left corner. The dashed line traces the one-to-one ratio, with differences of ±10% and 20% shown by the dotted lines. O2 stars are not included here.
Current usage metrics show cumulative count of Article Views (full-text article views including HTML views, PDF and ePub downloads, according to the available data) and Abstracts Views on Vision4Press platform.
Data correspond to usage on the plateform after 2015. The current usage metrics is available 48-96 hours after online publication and is updated daily on week days.
Initial download of the metrics may take a while.