Fig. 6
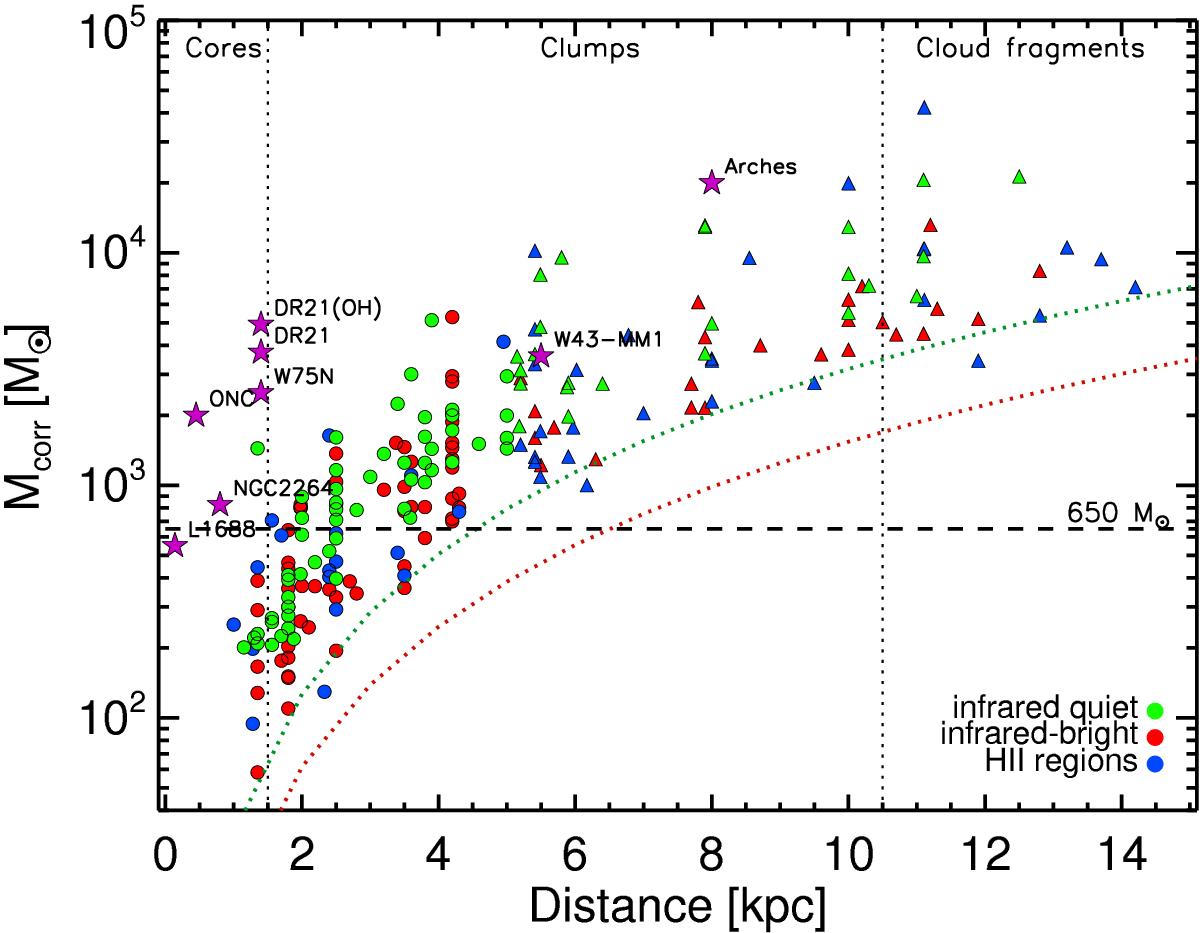
Temperature corrected mass versus distance distribution. Dotted lines show the mass sensitivity corresponding to the flux density threshold of 5 Jy using Td = 30 K for infrared-bright (red), and Td = 18 K for infrared-quiet clumps (green). Coloured symbols are shown in the figure legend; filled circles correspond to sources where our selection is complete, while filled triangles show sources where the sample is incomplete above 650 M⊙. The dashed horizontal line shows the 650 M⊙ limit for massive clumps potentially capable of forming high-mass stars from Csengeri et al. (2014). Known (proto)clusters from the literature are labelled with magenta stars, as are the estimated initial clump mass at half-radius for the galactic (super) star clusters like the Orion Nebula Cluster (ONC, e.g. Da Rio et al. 2012) and Arches (Habibi et al. 2013), following Tan et al. (2014). The approximate distance limit for detecting sources corresponding to cores, clumps, and cloud fragments is shown as a dotted line (Bergin & Tafalla 2007).
Current usage metrics show cumulative count of Article Views (full-text article views including HTML views, PDF and ePub downloads, according to the available data) and Abstracts Views on Vision4Press platform.
Data correspond to usage on the plateform after 2015. The current usage metrics is available 48-96 hours after online publication and is updated daily on week days.
Initial download of the metrics may take a while.