Fig. 3
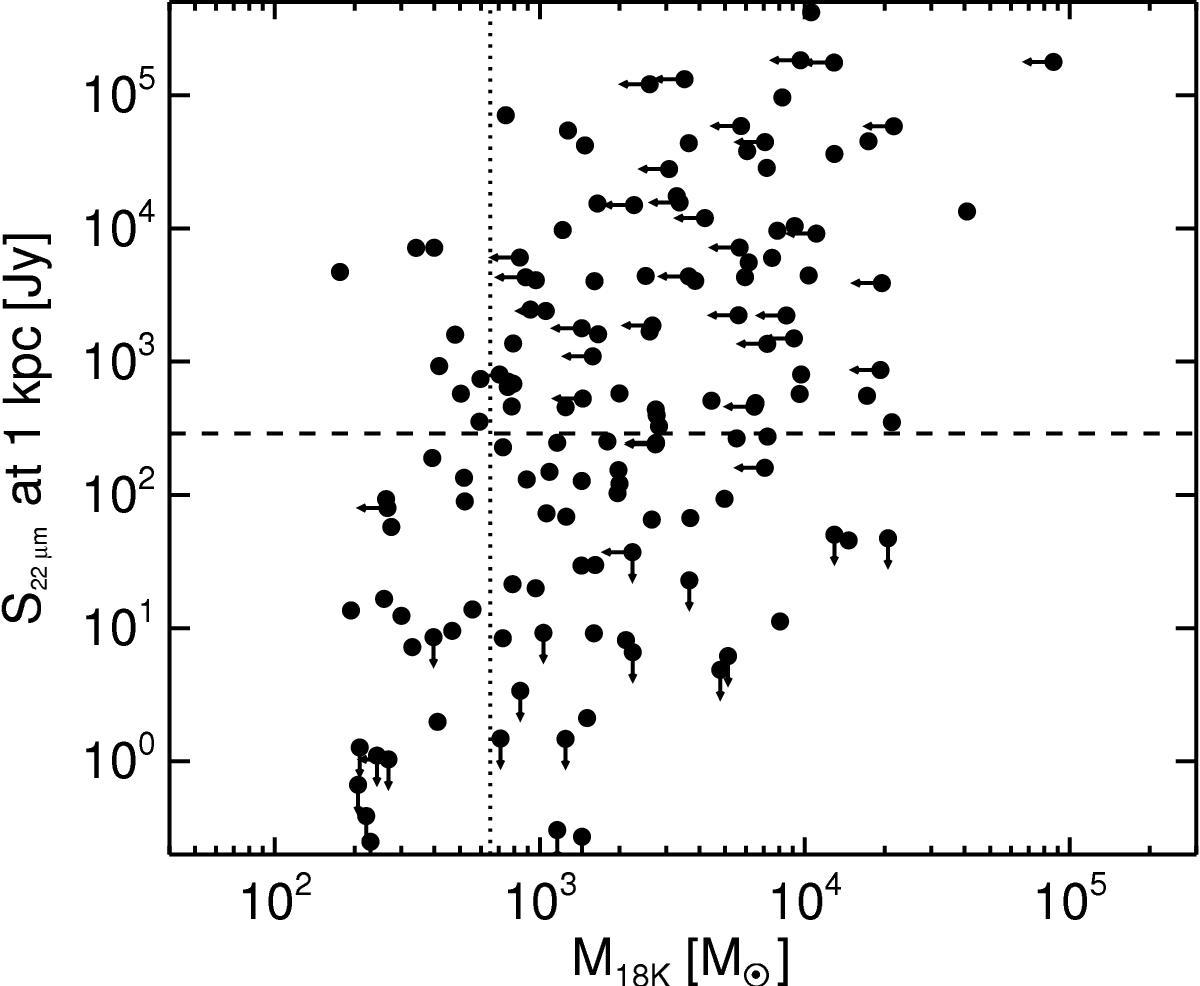
Distance scaled 22 μm flux density based on Spitzer/MIPS photometry and the WISE point source catalogue versus mass estimated from the ATLASGAL flux density. The mid-infrared flux densities have been scaled to a common wavelength. Symbols with arrows pointing left are sources with embedded UC-H II regions and upper limits for their mass estimate. Symbols with arrows pointing down correspond to upper limits for the 22 μm photometry. The dashed line shows the 289 Jy flux density threshold discussed in Sect. 2.6, and the dotted line corresponds to 650 M⊙.
Current usage metrics show cumulative count of Article Views (full-text article views including HTML views, PDF and ePub downloads, according to the available data) and Abstracts Views on Vision4Press platform.
Data correspond to usage on the plateform after 2015. The current usage metrics is available 48-96 hours after online publication and is updated daily on week days.
Initial download of the metrics may take a while.