Free Access
Fig. C.1
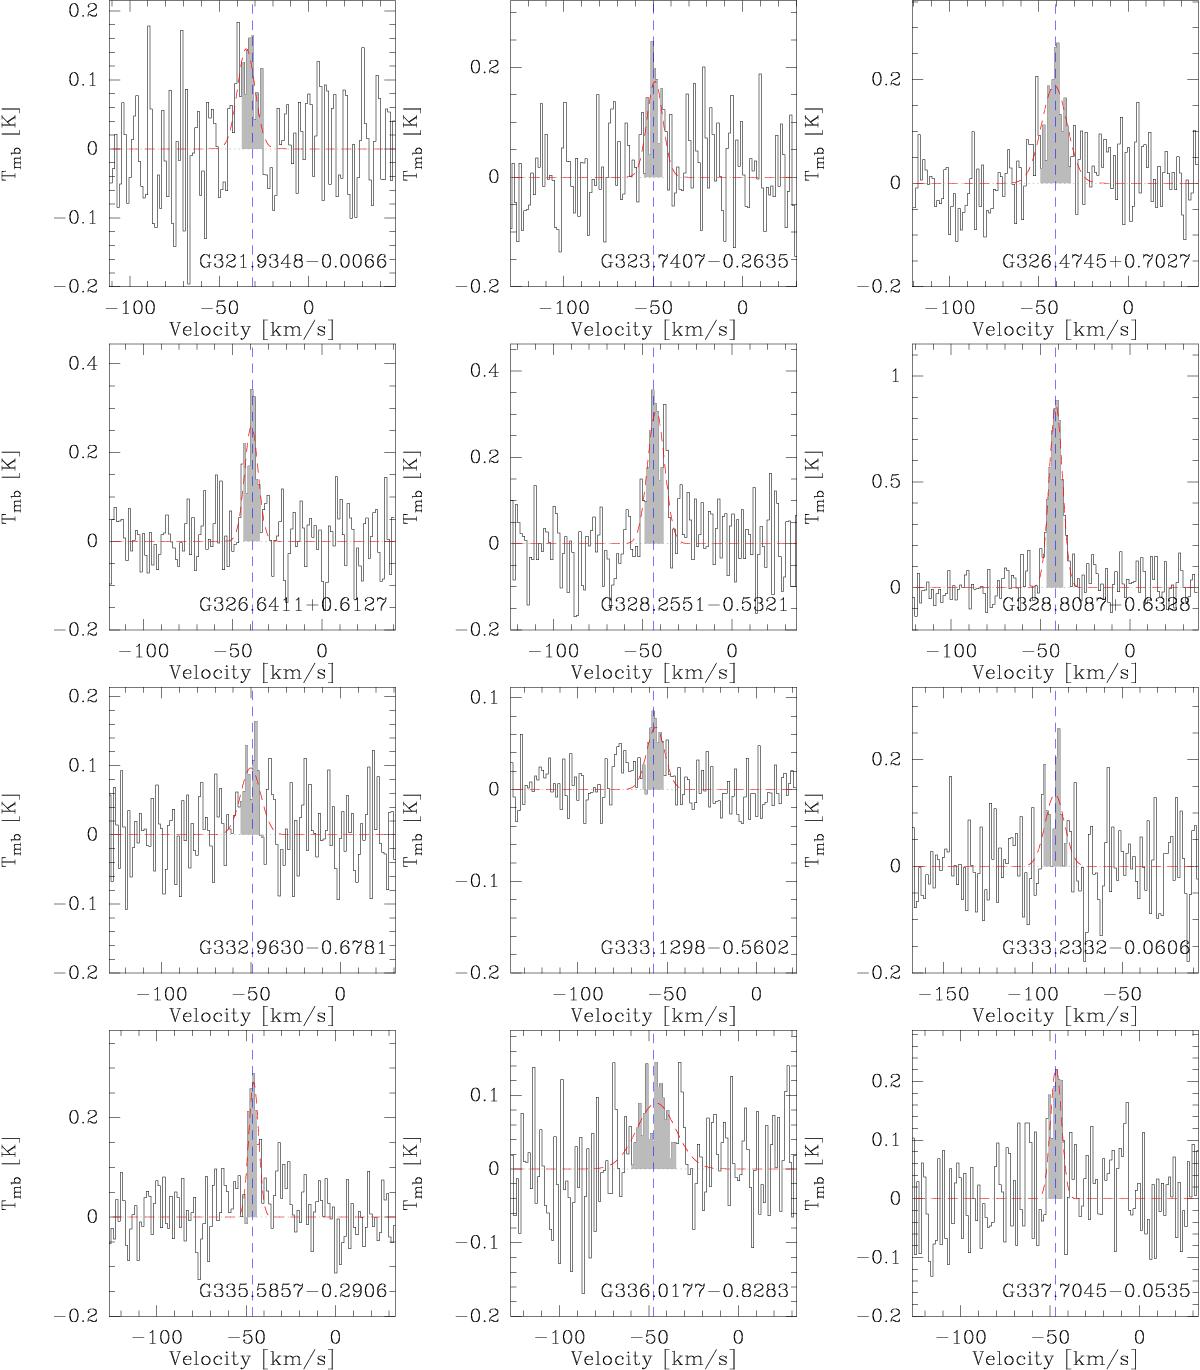
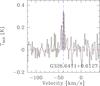
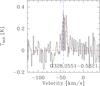
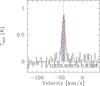
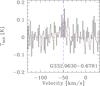
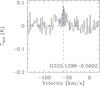
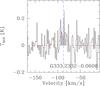
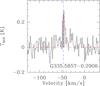
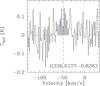
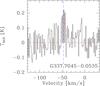
SiO (8–7) detections with the APEX/FLASH+ receiver of a selection of infrared-quiet massive clumps. The red dashed line shows the fitted Gaussians, and the grey histogram shows the line area. The blue dashed line indicates the vlsr of the sources.
This figure is made of several images, please see below:
Current usage metrics show cumulative count of Article Views (full-text article views including HTML views, PDF and ePub downloads, according to the available data) and Abstracts Views on Vision4Press platform.
Data correspond to usage on the plateform after 2015. The current usage metrics is available 48-96 hours after online publication and is updated daily on week days.
Initial download of the metrics may take a while.