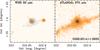
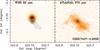
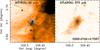
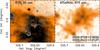
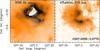
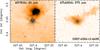
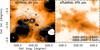
Fig. B.1
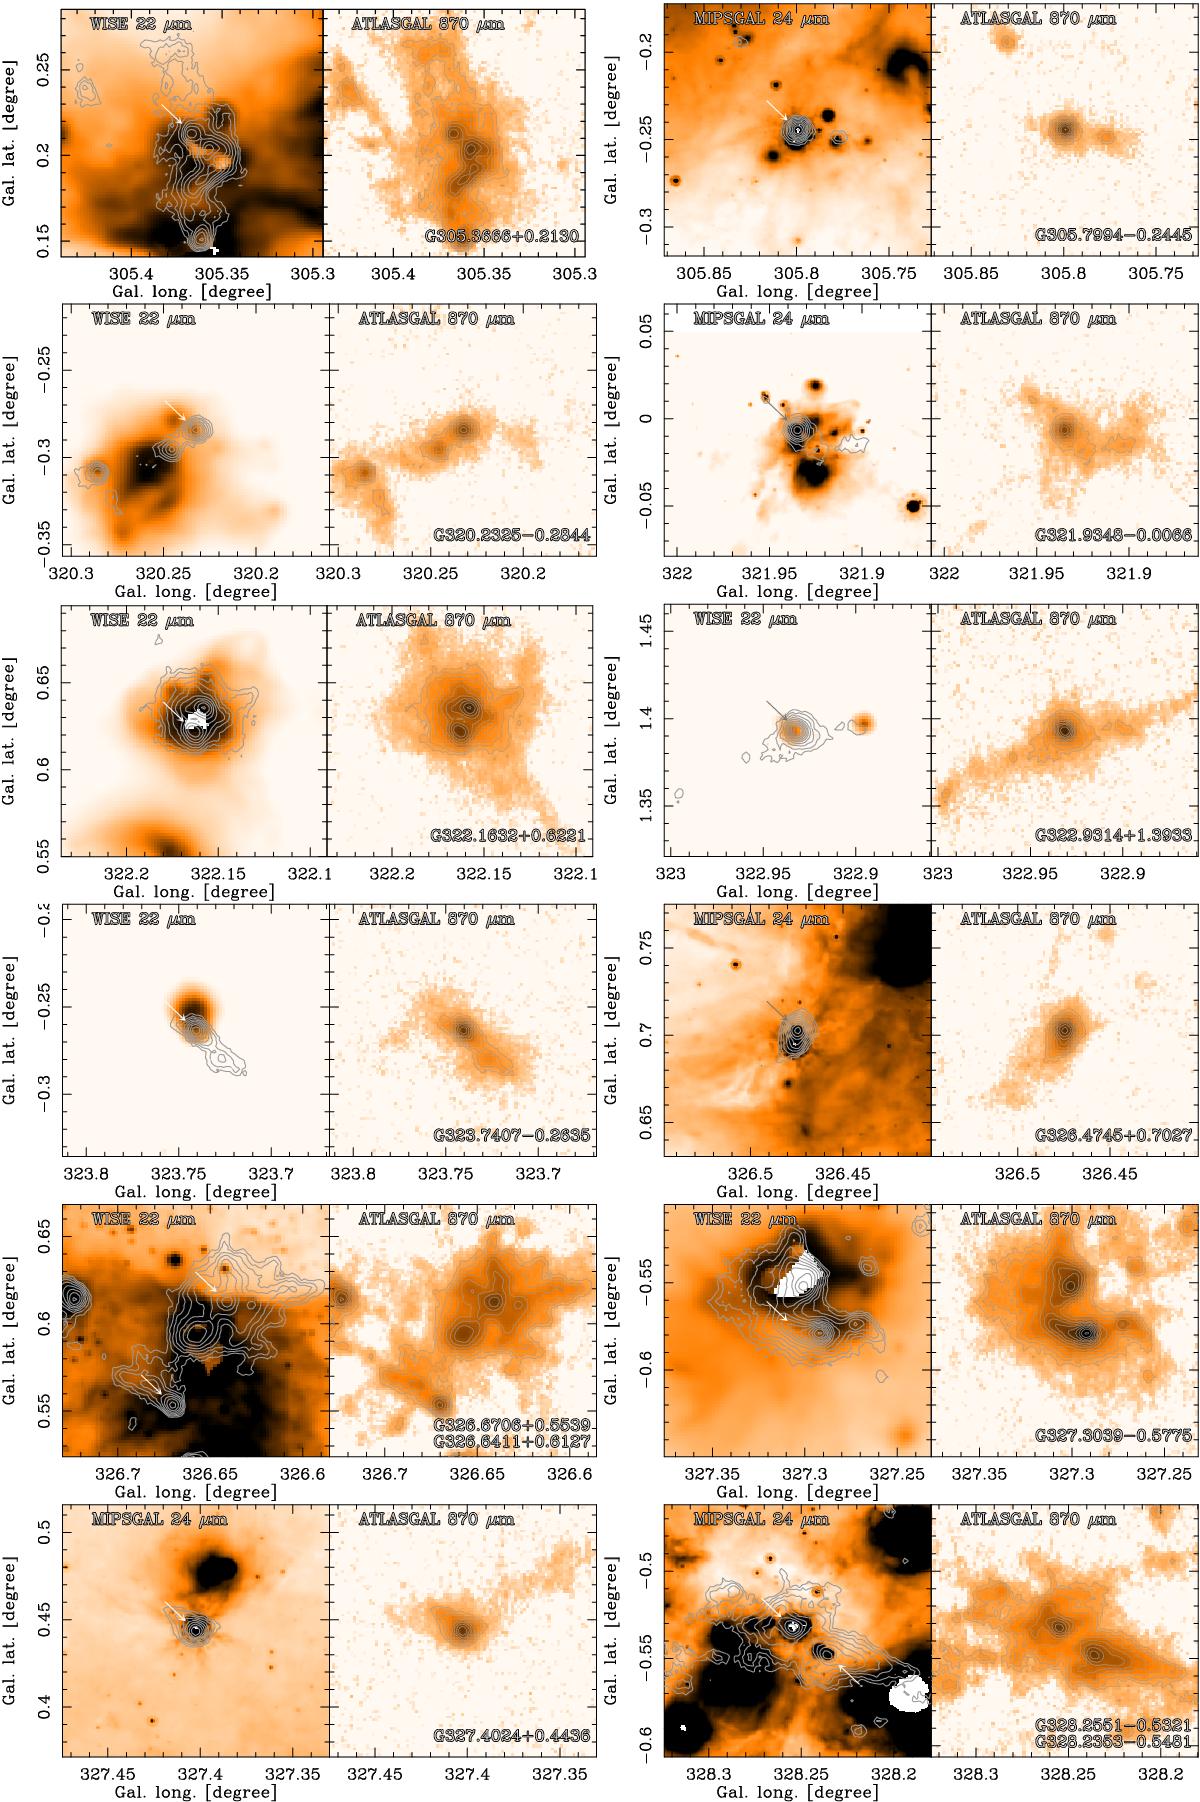
Left: mid-infrared emission from MIPSGAL at 24 μm or WISE at 22 μm in colour scale with the 870 μm contours from ATLASGAL. The arrows mark the position of infrared-quiet clumps. Right: 870 μm emission with contours from ATLASGAL. The blue crosses mark the positions of UC-H II regions from CORNISH. The figure label shows the corresponding ATLASGAL source name.
Current usage metrics show cumulative count of Article Views (full-text article views including HTML views, PDF and ePub downloads, according to the available data) and Abstracts Views on Vision4Press platform.
Data correspond to usage on the plateform after 2015. The current usage metrics is available 48-96 hours after online publication and is updated daily on week days.
Initial download of the metrics may take a while.