Fig. 13
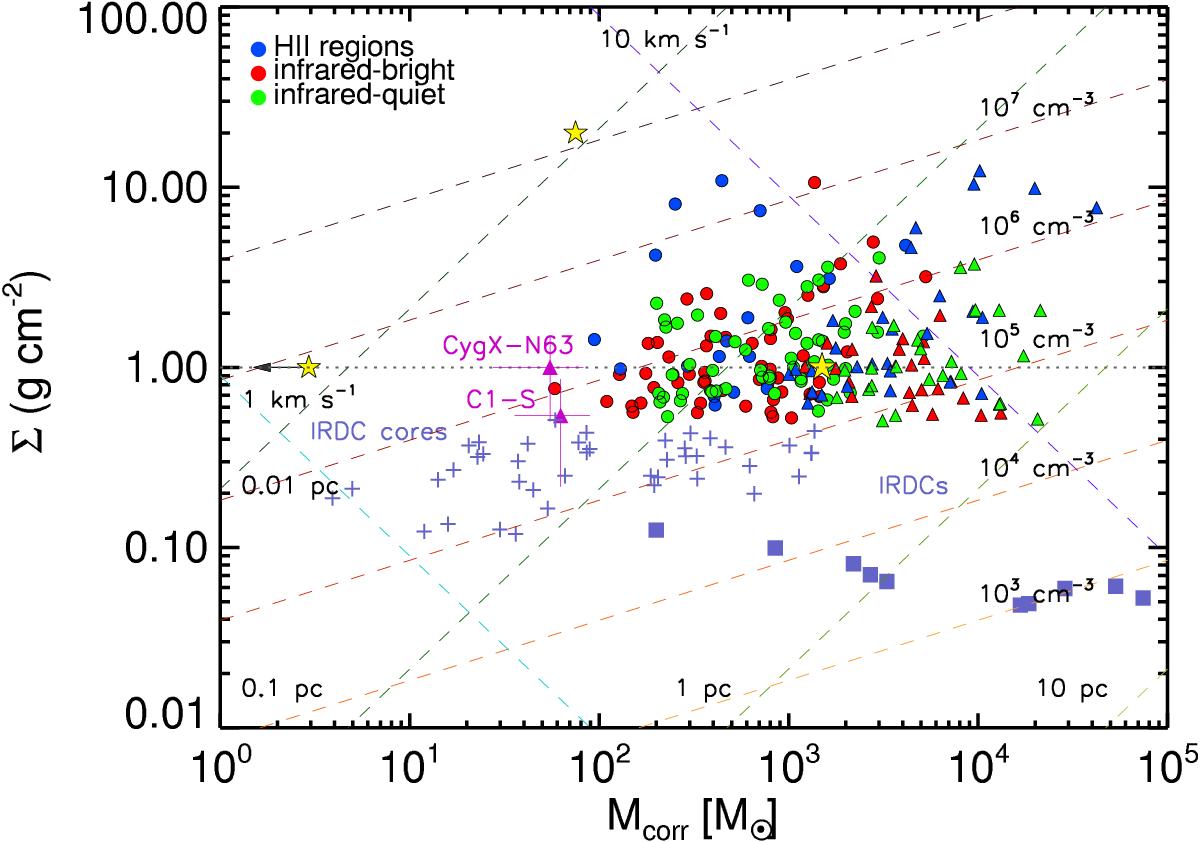
Surface-density, Σ, versus temperature corrected mass estimates (using Td = 30 K for the infrared-bright clumps). The coloured dashed lines in different shades show constant radius (green), nH number density (red), and escape speed (blue; see Tan et al. 2014). Colours and symbols are the same as in Fig. 8. We mark two massive cores with MMDC = 60 M⊙ (C1-S; Tan et al. 2013) and 55 M⊙ (CygX-N63; Bontemps et al. 2010). For comparison IRDC clumps (Kainulainen & Tan 2013) and cores are shown (Butler & Tan 2012). The dotted line marks the 1 g cm-3 value of Krumholz & McKee (2008).
Current usage metrics show cumulative count of Article Views (full-text article views including HTML views, PDF and ePub downloads, according to the available data) and Abstracts Views on Vision4Press platform.
Data correspond to usage on the plateform after 2015. The current usage metrics is available 48-96 hours after online publication and is updated daily on week days.
Initial download of the metrics may take a while.