Fig. 12
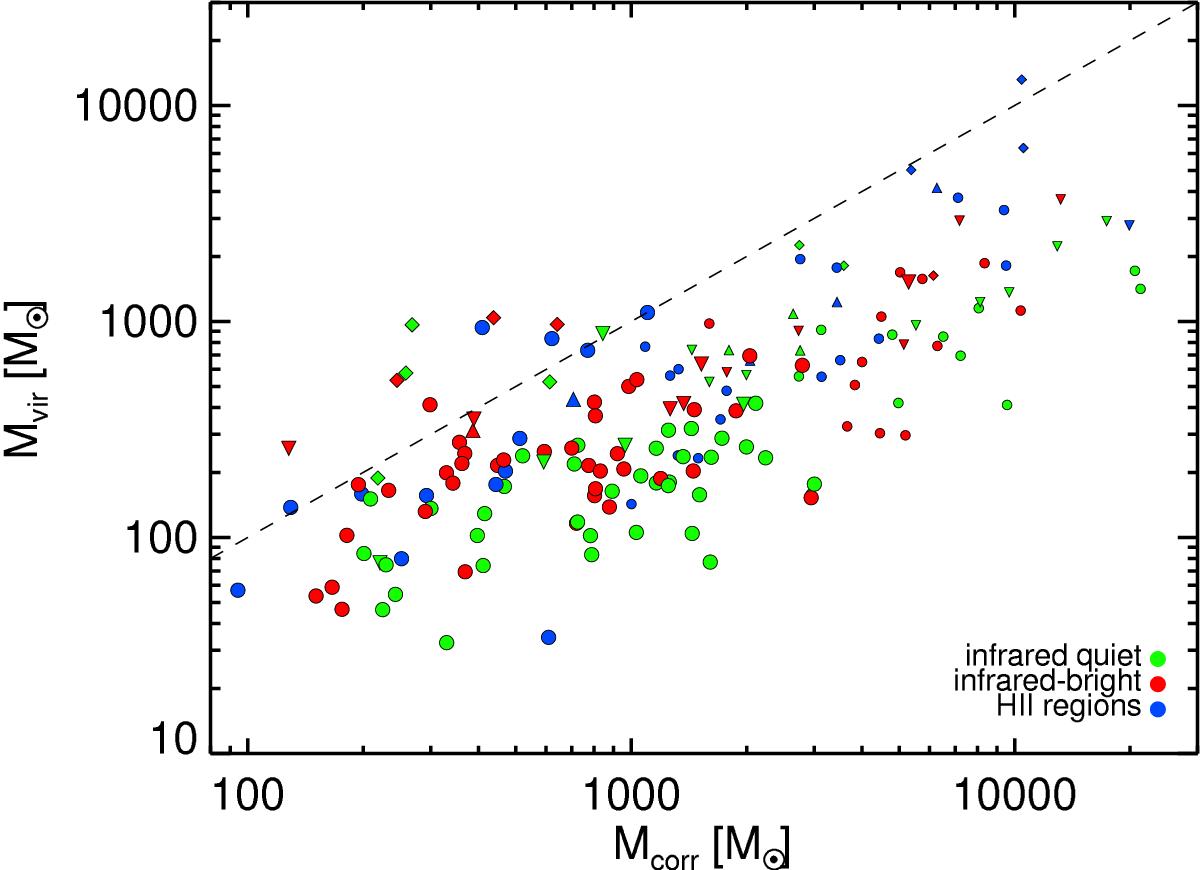
Temperature corrected clump mass estimates compared to the virial mass. The dashed line indicates where the virial mass equals the dust mass. Colours are the same as in Fig. 7, filled circles correspond to line width estimates from Wienen et al. (2012, 2015), filled upward triangle to that of Csengeri et al. (2016a), filled downward triangle to that of Wyrowski et al. (in prep.), filled diamonds to that of Bronfman et al. (1996). Sources with d > 5 kpc are plotted in smaller symbols.
Current usage metrics show cumulative count of Article Views (full-text article views including HTML views, PDF and ePub downloads, according to the available data) and Abstracts Views on Vision4Press platform.
Data correspond to usage on the plateform after 2015. The current usage metrics is available 48-96 hours after online publication and is updated daily on week days.
Initial download of the metrics may take a while.